Reference · Math of money
How US Income Tax Brackets Work: 2026 Rates and Examples
Each bracket taxes only the slice of income inside it. IRS 2026 and 2025 tables for every filing status, a $100,000 example and a calculator.
Rev. · 12 refs · 10 textbook or government · Ambient Math editors
A federal tax bracket taxes only the slice of taxable income inside it, so moving into a higher bracket never raises the rate on the money below it1. For tax year 2026 a single filer pays 10% up to $12,400 and 37% above $640,600, after a $16,100 standard deduction2.
- Brackets
- Seven federal rates, 10% to 37%3
- 2026 single
- 22% above $50,400; 37% above $640,6002
- Standard deduction 2026
- $16,100 single; $32,200 joint; $24,150 head of household2
- Which table
- 2026 rates for income earned in 2026, filed in 20272; 2025 rates for income earned in 20251
- $100,000 of wages, single
- Taxable $83,900; tax $13,170 (our arithmetic, 2026)4
- Senior deduction
- $6,000 for people 65 and older, 2025 through 20285
On this page
- Key takeaways
- How tax brackets work
- 2026 federal income tax brackets
- 2025 federal income tax brackets
- Standard deduction: taxable income comes first
- Marginal rate vs effective rate
- What tax bracket am I in if I make $100,000 per year?
- How are federal tax brackets determined?
- How do you avoid the 22% tax bracket?
- Who gets the new $6,000 tax break?
- What the brackets leave out
A tax bracket is a price list for slices of income, and the slice you are standing in sets only the price of your last dollars. That one idea clears up the worry about a raise “pushing you into a higher bracket”, and it is why the rate on a tax return and the share of income that actually goes to tax are different numbers. Below: how the layers work, the bracket tables for the current and the prior tax year in the four common filing statuses, what the standard deduction does before any bracket applies, a worked example at a round income, the rules that set and update the brackets, how deductions move taxable income, and a calculator. The money section has the rest of the household math.
Key takeaways
- Each bracket taxes only the income inside it, and the higher rate never reaches the income below1.
- Brackets apply to taxable income, which is income minus the standard deduction or itemized deductions6.
- For 2026 the standard deduction is $16,100 for single filers, $32,200 for joint filers and $24,150 for heads of household2.
- The 2026 tables are for money earned in 2026 and generally apply to returns filed in 20272.
- The 2025 tables are for money earned in 20251.
- A single filer’s 2026 rates run from 10% up to $12,400 to 37% above $640,6002.
- The dollar edges are indexed to inflation each year and the rates are not7.
- A $6,000 deduction for people 65 and older runs for 2025 through 20285.
How tax brackets work
You pay tax as a percentage of your income in layers called tax brackets, and as income goes up, the rate on the next layer is higher1. When income jumps into a higher bracket, the higher rate does not apply to all of it; it applies only to the part that is in the new bracket1. A tax bracket is the range of incomes taxed at given rates, and the ranges typically differ by filing status3. There are seven federal individual brackets, and the system is progressive: rates rise as income rises3.
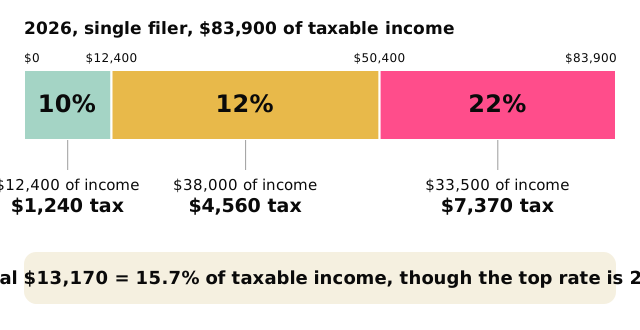
The figure splits one case into its layers. A single filer with $83,900 of taxable income pays 10% on the first $12,400, 12% on the next $38,000 and 22% on the last $33,500 (our arithmetic with the 2026 rates)2.
Worked example (our arithmetic). Inputs: taxable income of $83,900, a single filer, the 2026 rates and thresholds24.
| Layer | Income in the layer | Rate | Tax |
|---|---|---|---|
| First | $12,400 | 10% | $1,2404 |
| Second | $50,400 − $12,400 = $38,000 | 12% | $4,5604 |
| Third | $83,900 − $50,400 = $33,500 | 22% | $7,3704 |
| Total | $13,1704 |
The federal tax table gives the same total in one step: $5,800 plus 22% of the excess over $50,400, which is 5,800 + 0.22 × 33,500 = $13,170 (our arithmetic)4.
2026 federal income tax brackets
For tax year 2026 the top rate stays 37%, for single filers above $640,600 and for married couples filing jointly above $768,7002. The IRS announced the 2026 inflation adjustments on October 9, 2025, and they generally apply to returns filed in 20272. The other rates start at: 35% above $256,225 for single filers ($512,450 joint), 32% above $201,775 ($403,550 joint), 24% above $105,700 ($211,400 joint), 22% above $50,400 ($100,800 joint) and 12% above $12,400 ($24,800 joint)2. The 10% rate covers single incomes of $12,400 or less and joint incomes of $24,800 or less2.
The tables below come from the IRS revenue procedure on the 2026 adjustments, which gives each bracket as a base tax plus a rate on the excess4. They apply to taxable income, which is income after deductions.
Single filers, 2026
| Rate | Taxable income | Tax at the bottom of the bracket |
|---|---|---|
| 10% | Up to $12,400 | $0, then 10% of the income4 |
| 12% | $12,400 to $50,400 | $1,240 plus 12% of the excess over $12,4004 |
| 22% | $50,400 to $105,700 | $5,800 plus 22% of the excess over $50,4004 |
| 24% | $105,700 to $201,775 | $17,966 plus 24% of the excess over $105,7004 |
| 32% | $201,775 to $256,225 | $41,024 plus 32% of the excess over $201,7754 |
| 35% | $256,225 to $640,600 | $58,448 plus 35% of the excess over $256,2254 |
| 37% | Over $640,600 | $192,979.25 plus 37% of the excess over $640,6004 |
Married filing jointly and surviving spouses, 2026
| Rate | Taxable income | Tax at the bottom of the bracket |
|---|---|---|
| 10% | Up to $24,800 | $0, then 10% of the income4 |
| 12% | $24,800 to $100,800 | $2,480 plus 12% of the excess over $24,8004 |
| 22% | $100,800 to $211,400 | $11,600 plus 22% of the excess over $100,8004 |
| 24% | $211,400 to $403,550 | $35,932 plus 24% of the excess over $211,4004 |
| 32% | $403,550 to $512,450 | $82,048 plus 32% of the excess over $403,5504 |
| 35% | $512,450 to $768,700 | $116,896 plus 35% of the excess over $512,4504 |
| 37% | Over $768,700 | $206,583.50 plus 37% of the excess over $768,7004 |
Heads of household, 2026
| Rate | Taxable income | Tax at the bottom of the bracket |
|---|---|---|
| 10% | Up to $17,700 | $0, then 10% of the income4 |
| 12% | $17,700 to $67,450 | $1,770 plus 12% of the excess over $17,7004 |
| 22% | $67,450 to $105,700 | $7,740 plus 22% of the excess over $67,4504 |
| 24% | $105,700 to $201,750 | $16,155 plus 24% of the excess over $105,7004 |
| 32% | $201,750 to $256,200 | $39,207 plus 32% of the excess over $201,7504 |
| 35% | $256,200 to $640,600 | $56,631 plus 35% of the excess over $256,2004 |
| 37% | Over $640,600 | $191,171 plus 37% of the excess over $640,6004 |
Married filing separately, 2026
The married-filing-separately table matches the single table through the 35% bracket, which then ends at $384,350 instead of $640,6004.
| Rate | Taxable income | Tax at the bottom of the bracket |
|---|---|---|
| 10% | Up to $12,400 | $0, then 10% of the income4 |
| 12% | $12,400 to $50,400 | $1,240 plus 12% of the excess over $12,4004 |
| 22% | $50,400 to $105,700 | $5,800 plus 22% of the excess over $50,4004 |
| 24% | $105,700 to $201,775 | $17,966 plus 24% of the excess over $105,7004 |
| 32% | $201,775 to $256,225 | $41,024 plus 32% of the excess over $201,7754 |
| 35% | $256,225 to $384,350 | $58,448 plus 35% of the excess over $256,2254 |
| 37% | Over $384,350 | $103,291.75 plus 37% of the excess over $384,3504 |
2025 federal income tax brackets
The 2025 tables are for money earned in 2025, and the 2026 rates are for money earned in 20261. A return filed in 2026 therefore uses the 2025 table. Each bracket starts one dollar above the previous top, as the IRS lists them, and the last column is our arithmetic from the rates1.
Single filers, 2025
| Rate | Taxable income | Tax at the bottom of the bracket (our arithmetic) |
|---|---|---|
| 10% | Up to $11,9251 | $01 |
| 12% | $11,926 to $48,4751 | $1,192.501 |
| 22% | $48,476 to $103,3501 | $5,578.501 |
| 24% | $103,351 to $197,3001 | $17,6511 |
| 32% | $197,301 to $250,5251 | $40,1991 |
| 35% | $250,526 to $626,3501 | $57,2311 |
| 37% | $626,351 and up1 | $188,769.751 |
Married filing jointly and surviving spouses, 2025
| Rate | Taxable income | Tax at the bottom of the bracket (our arithmetic) |
|---|---|---|
| 10% | Up to $23,8501 | $01 |
| 12% | $23,851 to $96,9501 | $2,3851 |
| 22% | $96,951 to $206,7001 | $11,1571 |
| 24% | $206,701 to $394,6001 | $35,3021 |
| 32% | $394,601 to $501,0501 | $80,3981 |
| 35% | $501,051 to $751,6001 | $114,4621 |
| 37% | $751,601 and up1 | $202,154.501 |
Heads of household, 2025
| Rate | Taxable income | Tax at the bottom of the bracket (our arithmetic) |
|---|---|---|
| 10% | Up to $17,0001 | $01 |
| 12% | $17,001 to $64,8501 | $1,7001 |
| 22% | $64,851 to $103,3501 | $7,4421 |
| 24% | $103,351 to $197,3001 | $15,9121 |
| 32% | $197,301 to $250,5001 | $38,4601 |
| 35% | $250,501 to $626,3501 | $55,4841 |
| 37% | $626,351 and up1 | $187,031.501 |
Married filing separately, 2025
| Rate | Taxable income | Tax at the bottom of the bracket (our arithmetic) |
|---|---|---|
| 10% | Up to $11,9251 | $01 |
| 12% | $11,926 to $48,4751 | $1,192.501 |
| 22% | $48,476 to $103,3501 | $5,578.501 |
| 24% | $103,351 to $197,3001 | $17,6511 |
| 32% | $197,301 to $250,5251 | $40,1991 |
| 35% | $250,526 to $375,8001 | $57,2311 |
| 37% | $375,801 and up1 | $101,077.251 |
Brackets moved up from 2025 to 2026 because they are indexed, and the table shows by how much (our arithmetic from the two IRS tables)14.
Where each bracket ends, 2025 against 2026
| Filing status | Bracket top (rate) | 2025 | 2026 | Change |
|---|---|---|---|---|
| Single | 10% bracket | $11,925 | $12,400 | +$47514 |
| Single | 12% bracket | $48,475 | $50,400 | +$1,92514 |
| Single | 22% bracket | $103,350 | $105,700 | +$2,35014 |
| Single | 24% bracket | $197,300 | $201,775 | +$4,47514 |
| Single | 32% bracket | $250,525 | $256,225 | +$5,70014 |
| Single | 35% bracket | $626,350 | $640,600 | +$14,25014 |
| Joint | 10% bracket | $23,850 | $24,800 | +$95014 |
| Joint | 12% bracket | $96,950 | $100,800 | +$3,85014 |
| Joint | 22% bracket | $206,700 | $211,400 | +$4,70014 |
| Joint | 24% bracket | $394,600 | $403,550 | +$8,95014 |
| Joint | 32% bracket | $501,050 | $512,450 | +$11,40014 |
| Joint | 35% bracket | $751,600 | $768,700 | +$17,10014 |
Brackets moved up from 2025 to 2026 because they are indexed. The single 22% bracket begins above $48,475 for 20251 and above $50,400 for 20262, so the same taxable income can land in a lower bracket in 2026 than in 2025.
Standard deduction: taxable income comes first
Brackets apply to taxable income, not to what a paycheck or a wage statement shows. Deductions reduce the amount of taxable income, and in general a filer takes the standard deduction or itemizes6. The standard deduction is a specific dollar amount that reduces the income on which you are taxed8. It is adjusted each year for inflation and varies with filing status, with whether the filer is 65 or older or blind, and with whether another taxpayer can claim the filer as a dependent8. Filing status also helps determine the tax rate9. It generally depends on whether the filer is single or married9. It has to be settled before the standard deduction and the tax can be figured9. The filing requirements apply even when no tax is owed9.
| Filing status | Standard deduction, tax year 2025 | Standard deduction, tax year 2026 |
|---|---|---|
| Single | $15,7502 | $16,1002 |
| Married filing separately | $15,7502 | $16,1002 |
| Married filing jointly | $31,5002 | $32,2002 |
| Head of household | $23,6252 | $24,1502 |
A filer cannot take the standard deduction and itemize in the same year8. Itemizing makes sense when allowable itemized deductions on Schedule A are greater than the standard deduction6. Single or married is decided at the end of the tax year, which is December 31 for most taxpayers9. For 2025 the extra standard deduction for age 65 or older, or for blindness, is $1,6008.
Bracket and take-home check: what a given salary means
For wages with no other income or adjustments, taxable income is wages minus the standard deduction8. The next two tables apply that rule to round salaries (our arithmetic, 2026 tables and deductions)24.
| Wages | Taxable income | Bracket | Federal income tax | Share of wages |
|---|---|---|---|---|
| $40,000 | $23,900 | 12% | $2,620 | 6.55%4 |
| $60,000 | $43,900 | 12% | $5,020 | 8.37%4 |
| $80,000 | $63,900 | 22% | $8,770 | 10.96%4 |
| $120,000 | $103,900 | 22% | $17,570 | 14.64%4 |
| $160,000 | $143,900 | 24% | $27,134 | 16.96%4 |
| $220,000 | $203,900 | 32% | $41,704 | 18.96%4 |
| $300,000 | $283,900 | 35% | $68,134.25 | 22.71%4 |
| Wages | Taxable income | Bracket | Federal income tax | Share of wages |
|---|---|---|---|---|
| $60,000 | $27,800 | 12% | $2,840 | 4.73%4 |
| $100,000 | $67,800 | 12% | $7,640 | 7.64%4 |
| $150,000 | $117,800 | 22% | $15,340 | 10.23%4 |
| $200,000 | $167,800 | 22% | $26,340 | 13.17%4 |
| $250,000 | $217,800 | 24% | $37,468 | 14.99%4 |
| $350,000 | $317,800 | 24% | $61,468 | 17.56%4 |
| $500,000 | $467,800 | 32% | $102,608 | 20.52%4 |
Marginal rate vs effective rate
The marginal rate is the rate on the next dollar of taxable income, which is the rate of the bracket the last dollar falls in1. The effective rate is the total tax divided by income. Both are our definitions of two ratios, and the second is always lower than the first for anyone above the 10% bracket.
Worked example (our arithmetic). Inputs: a single filer, 2026 table, and the taxable incomes in the first column4.
| Taxable income | Tax | Marginal rate | Effective rate on taxable income |
|---|---|---|---|
| $20,000 | $2,152 | 12% | 10.76%4 |
| $50,000 | $5,752 | 12% | 11.50%4 |
| $75,000 | $11,212 | 22% | 14.95%4 |
| $100,000 | $16,712 | 22% | 16.71%4 |
| $150,000 | $28,598 | 24% | 19.07%4 |
| $250,000 | $56,456 | 32% | 22.58%4 |
| $500,000 | $143,769.25 | 35% | 28.75%4 |
| $700,000 | $214,957.25 | 37% | 30.71%4 |
At $700,000 of taxable income the marginal rate is 37% and the effective rate is 30.71% (our arithmetic), because the lower layers are taxed at lower rates4. The effective rate climbs toward the top rate and does not reach it.
The same ratios for the other two main filing statuses, 2026 tables, taxable income in the first column (our arithmetic)4:
Married filing jointly, 2026
| Taxable income | Tax | Marginal rate | Effective rate on taxable income |
|---|---|---|---|
| $25,000 | $2,504 | 12% | 10.02%4 |
| $50,000 | $5,504 | 12% | 11.01%4 |
| $100,000 | $11,504 | 12% | 11.50%4 |
| $150,000 | $22,424 | 22% | 14.95%4 |
| $250,000 | $45,196 | 24% | 18.08%4 |
| $400,000 | $81,196 | 24% | 20.30%4 |
| $600,000 | $147,538.50 | 35% | 24.59%4 |
| $800,000 | $218,164.50 | 37% | 27.27%4 |
Heads of household, 2026
The same ratios for head of household, 2026 table (our arithmetic)4:
| Taxable income | Tax | Marginal rate | Effective rate on taxable income |
|---|---|---|---|
| $20,000 | $2,046 | 12% | 10.23%4 |
| $50,000 | $5,646 | 12% | 11.29%4 |
| $75,000 | $9,401 | 22% | 12.53%4 |
| $100,000 | $14,901 | 22% | 14.90%4 |
| $150,000 | $26,787 | 24% | 17.86%4 |
| $250,000 | $54,647 | 32% | 21.86%4 |
| $500,000 | $141,961 | 35% | 28.39%4 |
| $700,000 | $213,149 | 37% | 30.45%4 |
Single filers, 2025
For comparison, the 2025 single table (rates and edges from the IRS page) gives these results (our arithmetic)1:
| Taxable income | Tax | Marginal rate | Effective rate on taxable income |
|---|---|---|---|
| $20,000 | $2,161.50 | 12% | 10.81%1 |
| $50,000 | $5,914 | 22% | 11.83%1 |
| $75,000 | $11,414 | 22% | 15.22%1 |
| $100,000 | $16,914 | 22% | 16.91%1 |
| $150,000 | $28,847 | 24% | 19.23%1 |
| $250,000 | $57,063 | 32% | 22.83%1 |
| $500,000 | $144,547.25 | 35% | 28.91%1 |
| $700,000 | $216,020.25 | 37% | 30.86%1 |
What tax bracket am I in if I make $100,000 per year?
For wage income of $100,000 with no other adjustments, the bracket follows from filing status and the standard deduction8. A single filer in 2026 subtracts $16,100 and has $83,900 of taxable income, which is in the 22% bracket24. A married couple filing jointly subtracts $32,200 and has $67,800, which is in the 12% bracket24. A head of household subtracts $24,150 and has $75,850, which is in the 22% bracket24.
Worked example (our arithmetic). Inputs: $100,000 of wages, the 2026 standard deduction for each status, the 2026 tables, no credits or other adjustments24.
| Filing status | Taxable income | Bracket | Federal income tax | Share of the $100,000 |
|---|---|---|---|---|
| Single | $83,900 | 22% | $13,1704 | 13.17%4 |
| Married filing jointly | $67,800 | 12% | $7,6404 | 7.64%4 |
| Head of household | $75,850 | 22% | $9,5884 | 9.59%4 |
The same pay lands in different brackets because the standard deduction and the bracket edges both depend on filing status9. The result leaves out credits, state tax, and payroll taxes, and it is arithmetic and not tax advice.
How are federal tax brackets determined?
The rates sit in the Internal Revenue Code, and the dollar edges of the brackets move each year by formula7. By law the Treasury Secretary must prescribe new tables each year, not later than December 15, for the following calendar year7. The tables raise the minimum and maximum dollar amount of each bracket by the cost-of-living adjustment and leave the rates unchanged7. The adjustment uses the Chained Consumer Price Index for All Urban Consumers, published by the Bureau of Labor Statistics7. An increase that is not a multiple of $50 is rounded down to the next lowest multiple of $507.
The IRS publishes the result as a revenue procedure; for 2026 it adjusts more than 60 provisions including the rate tables24. The same 2026 adjustments set the alternative minimum tax exemption for unmarried individuals at $90,100, beginning to phase out at $500,0002.
How do you avoid the 22% tax bracket?
The bracket depends on taxable income, so the question is really about what lowers taxable income. Two examples from IRS rules show the mechanics. Elective deferrals to a 401(k) are made on a pretax basis and are not reported as wages on Form 104010. The 401(k) employee contribution limit is $24,500 for 2026, up from $23,500 for 202511. The standard deduction is the other lever: it comes off income before the brackets apply8.
Worked example (our arithmetic). Inputs: a single filer, $100,000 of wages, the 2026 tables, and a pretax 401(k) deferral at the 2026 limit, with no other changes41110.
| Case | Taxable income | Federal income tax | Change |
|---|---|---|---|
| No deferral | $83,900 | $13,1704 | none |
| $24,500 deferred | $83,900 − $24,500 = $59,400 | $7,7804 | −$5,390, which is 22% of $24,5004 |
The deferral lowers tax by the marginal rate times the amount, 22% × 24,500 = $5,390, and the filer is still in the 22% bracket because $59,400 is above $50,4004. Leaving the 22% bracket would take taxable income at or below $50,400, or a further $9,000 of reduction in this case (our arithmetic)4. Deferrals are still counted as wages for Social Security and Medicare taxes10. This shows how the arithmetic works and is not a recommendation to contribute.
Who gets the new $6,000 tax break?
The $6,000 deduction is for people age 65 and older. Effective for 2025 through 2028, an individual who is 65 or older may claim an additional deduction of $6,000, on top of the additional standard deduction for seniors5. It is per eligible person, so a married couple where both spouses qualify can take $12,0005. It phases out for modified adjusted gross income over $75,000 ($150,000 for joint filers)5. A filer needs a valid Social Security number, files a joint return if married, and claims the deduction on Schedule 1-A of Form 10408.
It is separate from the standard deduction8. A deduction lowers taxable income, so its value depends on the bracket.
Worked example (our arithmetic). Inputs: a $6,000 deduction applied to income that is entirely inside one bracket5.
| Marginal bracket | Tax saved | Calculation |
|---|---|---|
| 10% | $600 | 6,000 × 10%5 |
| 12% | $720 | 6,000 × 12%5 |
| 22% | $1,320 | 6,000 × 22%5 |
The 2025 law also created deductions for tips, overtime pay and car loan interest, each effective for 2025 through 2028 and each capped by size and by income5.
| Deduction | Maximum | Phases out above modified adjusted gross income of |
|---|---|---|
| Qualified tips | $25,0005 | $150,000, or $300,000 joint5 |
| Qualified overtime pay | $12,500, or $25,000 joint5 | $150,000, or $300,000 joint5 |
| Car loan interest | $10,0005 | $100,000, or $200,000 joint5 |
| Seniors, age 65 and older | $6,000 per person5 | $75,000, or $150,000 joint5 |
Try your own numbers
Federal bracket calculator
Ordinary income only, before credits, with the tables on this page. Nothing you type leaves this page.
- Taxable income
- –
- Federal income tax
- –
- Marginal rate
- –
- Effective rate
- –
The default inputs reproduce the single filer’s $13,170 above4. The calculator applies the standard deduction from the table above and the bracket edges from this page, and it leaves out credits, other taxes and the extra deductions listed earlier.
What the brackets leave out
The brackets cover ordinary income. Net capital gains can be taxed at a lower rate than ordinary income12. Generally, an asset held for more than one year before it is sold produces a long-term gain12. For 2025 the 0% capital gains rate applies up to $48,350 of taxable income for single filers, and above the thresholds for the 15% rate a 20% rate applies12.
| Filing status | 0% rate, taxable income up to | 15% rate, taxable income above that and up to |
|---|---|---|
| Single | $48,35012 | $533,40012 |
| Married filing separately | $48,35012 | $300,00012 |
| Married filing jointly and qualifying surviving spouse | $96,70012 | $600,05012 |
| Head of household | $64,75012 | $566,70012 |
Gains from collectibles such as coins or art are taxed at a maximum of 28%12. Net short-term capital gains are taxed as ordinary income at the graduated rates in the tables12. Social Security and Medicare taxes are separate from the brackets: a 401(k) deferral skips income tax withholding but still counts as wages for them10.
For the compounding behind retirement balances see the retirement savings math; for how a rate quoted per year turns into a yearly yield, APR vs APY; and for the yearly cost of a loan, how long it takes to pay off a loan. The IRS pages behind this one are the federal rates and brackets page, the 2026 adjustment announcement and the standard deduction topic.
RelatedHow Much Do You Need to Retire? The Math, Step by StepAPR vs APY: The Difference, With the Math and ExamplesHow Long to Pay Off a Loan: Formula and Calculator
Sources
- Federal income tax rates and brackets · Internal Revenue Service · irs.gov · checked October 21, 2026
- IRS releases tax inflation adjustments for tax year 2026, including amendments from the One, Big, Beautiful Bill · Internal Revenue Service (IR-2025-103, October 9, 2025) · irs.gov · checked October 21, 2026
- Tax Brackets (Tax Foundation tax glossary) · Tax Foundation · taxfoundation.org · checked October 21, 2026
- Revenue Procedure 2025-32, section 4: 2026 adjusted items · Internal Revenue Service · irs.gov · checked October 21, 2026
- Working Families Tax Cuts: Tax deductions for working Americans and seniors (FS-2025-03) · Internal Revenue Service · irs.gov · checked October 21, 2026
- Topic no. 501, Should I itemize? · Internal Revenue Service · irs.gov · checked October 21, 2026
- 26 U.S. Code § 1 - Tax imposed · Legal Information Institute, Cornell Law School · law.cornell.edu · checked October 21, 2026
- Topic no. 551, Standard deduction · Internal Revenue Service · irs.gov · checked October 21, 2026
- Publication 501, Dependents, Standard Deduction, and Filing Information · Internal Revenue Service · irs.gov · checked October 21, 2026
- Topic no. 424, 401(k) plans · Internal Revenue Service · irs.gov · checked October 21, 2026
- 401(k) limit increases to $24,500 for 2026, IRA limit increases to $7,500 · Internal Revenue Service · irs.gov · checked October 21, 2026
- Topic no. 409, Capital gains and losses · Internal Revenue Service · irs.gov · checked October 21, 2026
Published . Every source shows the day it was read. Diagrams: original, by the editors. How we check facts · Report an error.