How it works · Math of money
How Much Do You Need to Retire? The Math, Step by Step
A retirement number is one division: yearly spending minus Social Security, over a withdrawal rate. Worked examples, 2026 limits and a calculator.
Checked against 11 sources (11 textbook, course or government) · By Ambient Math editors
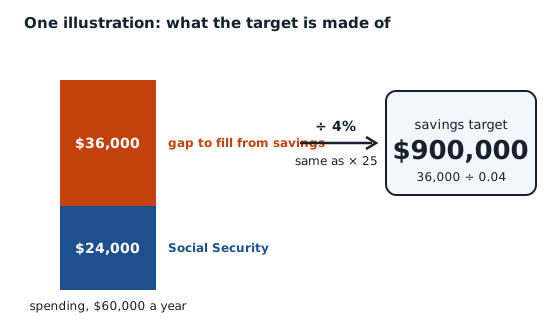
The short answer. Take yearly spending, subtract what Social Security will pay, and divide the gap by a withdrawal rate; at 4% the target is 25 times the gap6. Spending of $60,000 with $24,000 from Social Security leaves a $36,000 gap and a $900,000 target (our arithmetic, using the 4% rate of the Trinity study6). The 4% rate comes from historical 30-year simulations, not a guarantee6.
- Target
- (Yearly spending − Social Security) ÷ withdrawal rate; at 4%, 25 × the gap6
- Social Security
- Built from the best 35 years of indexed earnings; missing years count as zero3
- Claiming age
- Earliest 62 at 70% of the full amount; 100% at 67 for births from 19603
- 2026 limits
- 401(k) $24,500; IRA $7,500; 50+ catch-up $8,000 in a 401(k)1
- Medicare
- Parts A and B open at 659
- Early withdrawals
- An extra 10% tax before age 59½ unless an exception applies2
On this page
- The retirement number in one line
- Step 1: spending, not salary
- Step 2: how Social Security is calculated
- Step 3: the withdrawal rate
- Step 4: building the pile
- What you may put in during 2026
- Inflation changes the answer
- Can I retire at 62 with $400,000?
- Can I retire at 40 with $2 million?
- What typical savings look like
- Mistakes that spoil the number
- Next steps
A retirement number is not one mystery figure. It is a chain of four small calculations: what you will spend, how much of that other income covers, how fast savings can be drawn down, and how long it takes to build the pile. Below, each link gets worked numbers you can change, a calculator joins them, and the 2026 limits1 and rules sit where they matter. It is arithmetic, not advice: every figure is a worked example, and the inputs that decide the answer, spending and returns, are yours. The money section holds the formulas used here.
The retirement number in one line
The target is the yearly gap between spending and guaranteed income, divided by a withdrawal rate. Dividing by 4% is the same as multiplying by 25, so a $36,000 gap becomes $900,000 (our arithmetic, using the 4% rate of the Trinity study6). The 4% rate has a history: Cooley, Hubbard and Walz, known as the Trinity study, tested withdrawal rates from savings against rolling periods of U.S. market data6. Together with an earlier study, it was meant to dispel the notion that withdrawal rates like 6 percent or 7 percent are safe6.
- Estimate yearly spending in today's dollars. Spending, not salary, sets the need; the next section shows why3.
- Subtract income that does not come from savings. For most workers that is mainly Social Security, whose formula is worked out below3.
- Divide the gap by a withdrawal rate. A classic finding uses 4% a year, adjusted for inflation, over 30 years6.
- Compare the result with what your savings will grow to. The savings annuity formula does that, and the calculator below runs it7.
Step 1: spending, not salary
Replacement-rate rules such as “70% of your salary” hide a trap, because the share of pay that Social Security replaces falls as earnings rise: the replacement rate is 83% for very low earners and 37% for high earners3. A hypothetical medium earner in the Congressional Research Service example has average indexed monthly earnings of $4,618 and a primary insurance amount of $2,071.603. Worked example (our arithmetic). Inputs3: 2,071.60 ÷ 4,618 = 0.449, so Social Security replaces about 45% of that worker’s average indexed earnings3.
Because the share differs by person, the lowest-error starting point is the yearly spending you expect, written in today’s dollars. The rest of this page uses $60,000 a year as an illustration, with $2,000 a month ($24,000 a year) coming from Social Security. Those two inputs are assumptions chosen for the example, and the calculator lets you replace them3.
Step 2: how Social Security is calculated
Social Security turns your work history into a monthly benefit in two steps. First comes average indexed monthly earnings, AIME: for retired workers it is the average of the highest 35 years of indexed earnings, divided by 123. If the person worked fewer than 35 years in covered employment, the missing years count as zeros3. A worker is first eligible for retirement benefits at 62 and must generally have worked for 10 years3.
Second comes the primary insurance amount, PIA, the benefit at full retirement age. The AIME is cut into three brackets at two dollar amounts called bend points, which are $1,286 and $7,749 for workers who become eligible in 20264. Three factors fixed in law, 90%, 32% and 15%, apply to the three brackets3. The PIA is rounded down to the nearest dime3.
Worked example (our arithmetic). Inputs: an AIME of $5,000 (an illustration, not an average). Bend points4 and factors3 as above.
| Bracket | Calculation | Result |
|---|---|---|
| First $1,286 at 90% | 0.90 × 1,286 | $1,157.403 |
| $1,286 to $7,749 at 32% | 0.32 × (5,000 − 1,286) | $1,188.483 |
| Above $7,749 at 15% | 0.15 × 0 | $0.003 |
| Total, rounded down to the dime | 1,157.40 + 1,188.48 | PIA of $2,345.803 |
The formula is progressive, which is why the share returned shrinks as earnings rise (shares computed by us, our arithmetic).
| AIME (monthly) | PIA at full retirement age | Share of AIME replaced |
|---|---|---|
| $3,000 | $1,705.80 | 56.9%34 |
| $5,000 | $2,345.80 | 46.9%34 |
| $7,000 | $2,985.80 | 42.7%34 |
| $9,000 | $3,413.20 | 37.9%34 |
The claiming age changes the check
For workers born in 1960 or later the full retirement age is 673. A claim before it carries a permanent reduction of five-ninths of 1% a month for the first three years and five-twelfths of 1% a month beyond that3. Claiming after it earns a delayed retirement credit of 8% for each year, up to age 703. In the Congressional Research Service table the PIA share is 70.0% at 62, 86.6% at 65, 100.0% at 67 and 124.0% at 703.
Worked example (our arithmetic). Inputs: the $2,345.80 PIA above and the shares3. Benefits round down to the dollar and exclude later cost-of-living adjustments3.
| Claim at | Share of PIA | Monthly check |
|---|---|---|
| 62 | 70.0% | $1,6423 |
| 65 | 86.6% | $2,0313 |
| 67 | 100.0% | $2,3453 |
| 70 | 124.0% | $2,9083 |
Cost-of-living adjustments come on top: the most recent was 2.8%, paid in January 202634.
What earnings produce a $3,000 monthly check?
Run the formula backwards. To reach a PIA of $3,000 at full retirement age, the AIME must fall in the middle bracket, so $3,000 = 1,157.40 + 0.32 × (AIME − 1,286). That gives an AIME of about $7,045 a month (our arithmetic)34.
Worked example (our arithmetic). Inputs: the 2026 bend points4, the factors and claiming shares3; benefit before cost-of-living adjustments.
| Claim at | Share of PIA | PIA needed for $3,000 | AIME needed | Per year |
|---|---|---|---|---|
| 62 | 70% | $4,286 | about $14,818 | about $177,80034 |
| 67 | 100% | $3,000.20 | $7,045 | $84,54034 |
| 70 | 124% | $2,419.40 | $5,230 | $62,76034 |
The yearly column is the indexed 35-year average, set against the 2026 taxable maximum of $184,500, above which earnings are not counted34. Waiting from 62 to 70 cuts the needed history by almost two thirds (our arithmetic).
Step 3: the withdrawal rate
A withdrawal rate is the share of the starting balance taken out in the first year, then raised with inflation. A classic finding from the Trinity study is the case of an inflation-adjusted 4 percent withdrawal rate over a 30-year retirement horizon with a fixed 50/50 strategic asset allocation of stocks and bonds6. In rolling periods of the historical data, that strategy had a 96 percent success rate6. The count behind the 96 is 55 starting years from 1926 to 1980, of which the 4 percent rate failed twice, in 1965 and 1966, so the success rate is 53/55 = 96.4 percent6.
Success is not a guarantee. At a 5 percent rate, 17 of the 55 retirement dates fell short, which leaves a 69 percent success rate6. The data are one country’s: for 30-year retirements, the 4 percent rule failed in 62.5 percent of the historical cases in Italy and in 42.5 percent of the historical cases in France6. The paper warns that retirees who think of 4 percent as a worst-case rate will be ill-prepared for the spending cuts that flexibility may entail6. Its author argues that conservative retirees should adjust forecasts for future returns downward, which implies lower sustainable withdrawal rates6. The paper dates from May 26, 2011, so newer research may differ6.
Worked example (our arithmetic). The target for a yearly gap at three withdrawal rates, from the formula target = gap ÷ rate. The 4% and 5% rates are the two rates tested in the study6; 3% is a more cautious illustration.
| Yearly gap | At 3% | At 4% | At 5% |
|---|---|---|---|
| $20,000 | $666,667 | $500,000 | $400,0006 |
| $30,000 | $1,000,000 | $750,000 | $600,0006 |
| $36,000 | $1,200,000 | $900,000 | $720,0006 |
| $40,000 | $1,333,333 | $1,000,000 | $800,0006 |
| $50,000 | $1,666,667 | $1,250,000 | $1,000,0006 |
Payout annuity math is a different question
A payout annuity starts with money in the account and takes money out on a regular basis, with the remaining money earning interest, until after a fixed amount of time the account is empty8. Payout annuities are typically used after retirement8. With P as the starting balance, w the regular withdrawal and r the annual rate, the textbook formula is P = w × (1 − (1 + r/k)^(−kt)) ÷ (r/k)8. In a textbook example, $1000 a month for 20 years at 6% interest needs $139,600 in the account8.
Worked example (our arithmetic). Inputs: $36,000 a year for 30 years, yearly withdrawals, a constant rate. Payout formula8.
These totals sit below $900,000 because the formula fixes the return and the payment. The Trinity method instead replays real market sequences with inflation-adjusted withdrawals, the harder question6. The two answers measure different risks, so the gap between them is the price of not knowing returns in advance.
Step 4: building the pile
Most retirement plans like 401k plans or IRA plans are examples of savings annuities7. In the annuity formula, A is the balance after t years, d is the regular deposit, r is the annual interest rate in decimal form and k is the number of compounding periods in one year7: A = d × ((1 + r/k)^(tk) − 1) ÷ (r/k). The textbook case is $100 a month into an IRA earning 6% for 20 years, which grows to $46,200 from $24,000 of deposits7.
Worked example (our arithmetic). Solve the formula for the deposit d. Inputs: a $900,000 target (the 4% example above), monthly deposits, the rates in the first row. Savings annuity formula7.
| Years of saving | At 4% | At 6% | At 8% |
|---|---|---|---|
| 30 | $1,296.74 a month | $895.95 a month | $603.88 a month7 |
| 40 | $761.45 a month | $451.92 a month | $257.81 a month7 |
Ten extra years cut the monthly amount by about half at 6% (our arithmetic). That is the compounding in the Rule of 72: at 6% money doubles roughly every 12 years, so more doublings carry the load7.
The textbook’s own goal example, $200,000 in 30 years at 8%, needs a deposit of $134.09 a month7. Using the unrounded monthly rate gives $134.20; the textbook rounds the rate to 1.00667 along the way (our arithmetic).
What you may put in during 2026
The IRS announced the 2026 limits on November 13, 20251. The annual limit for 401(k), 403(b), governmental 457 and Thrift Savings Plan participants rose to $24,500 from $23,5001. The limit on annual IRA contributions rose to $7,500 from $7,0001. These limits are reset by the IRS each year, so a later year will differ.
| Account | 2026 limit |
|---|---|
| 401(k), 403(b), governmental 457, Thrift Savings Plan | $24,5001 |
| Catch-up for ages 50 and over in most of those plans | $8,000, so up to $32,500 in all1 |
| Higher catch-up for ages 60 to 63 | $11,250 instead of $8,0001 |
| IRA | $7,5001 |
| IRA catch-up for ages 50 and over | $1,1001 |
| SIMPLE plan | $17,0001 |
Worked example (our arithmetic). Inputs: deposits at the 2026 limits for a worker under 50, held fixed for 30 years at a 6% return with monthly deposits. 2026 limits1, savings annuity formula7.
| Contribution | Per year | Balance after 30 years |
|---|---|---|
| 401(k) at the limit | $24,500 | $2,050,88517 |
| IRA at the limit | $7,500 | $627,82217 |
| Both | $32,000 | $2,678,70717 |
Limits cap the pace of saving, not the amount that is needed. Most retirement plan distributions are subject to income tax2, so a balance and the spendable income it supports differ by the tax owed.
Try your own numbers
Retirement target calculator
Everything is in today's dollars: the return is reduced by inflation, and your monthly saving is assumed to rise with prices. Nothing you type leaves this page.
- Savings at retirement
- –
- Target
- –
- Ahead or behind
- –
- Saving needed
- –
Worked example (our arithmetic). The defaults above, which are assumptions and not forecasts. Inflation of 2% is the Federal Reserve’s longer-run goal10; 4% is the withdrawal rate of the Trinity example6; the savings formula is the annuity formula7.
| Step | Calculation | Result |
|---|---|---|
| Real return | 1.06 ÷ 1.02 − 1 | 3.92% a year10 |
| Months of saving | (67 − 35) × 12 | 3847 |
| Savings in today’s dollars | 50,000 growth plus 1,000 a month of deposits | $926,3217 |
| Target | (60,000 − 24,000) ÷ 0.04 | $900,0006 |
| Margin | 926,321 − 900,000 | $26,321 ahead67 |
| Monthly saving that just reaches the target | solve the annuity for d | $9657 |
Inflation changes the answer
The Federal Reserve judges that inflation of 2 percent over the longer run, measured by the annual change in the price index for personal consumption expenditures, is most consistent with its mandate for maximum employment and price stability10. At 2% a year, $60,000 of today’s spending costs 60,000 × 1.02^30 = $108,682 in 30 years, and a dollar then buys about 55 cents of today’s goods (our arithmetic)10. That is why this page works in today’s dollars and cuts the return by inflation.
Fees work the same way as a lower return. Even small differences in fees can translate into large differences in returns over time, and a fund with high costs must perform better than a low-cost fund to generate the same returns11. The Rule of 72 shows the size of a 1% fee: at 6% money doubles every 12 years instead of every 10.3 years at 7%11.
Can I retire at 62 with $400,000?
Run the same chain with a smaller pile. The only free input is spending, so the table shows the withdrawal rate each spending level would need. Worked example (our arithmetic). Inputs: a $400,000 balance; an illustrative AIME of $5,000, a 70% benefit at 623, and the PIA computed earlier, giving $1,642 a month, or $19,704 a year.
| Yearly spending | Gap after Social Security | Withdrawal rate on $400,000 |
|---|---|---|
| $30,000 | $10,296 | 2.6%3 |
| $40,000 | $20,296 | 5.1%3 |
| $50,000 | $30,296 | 7.6%3 |
Compare each rate with the historical record: the 4 percent rate had a 96 percent success rate over 30 years, and 5 percent a 69 percent success rate6. A retirement that starts at 62 and lasts to 92 is that 30-year window. Two dates matter besides the arithmetic. A claim at 62 locks in the reduced check for life3, and Medicare Part A and Part B are available from age 65, so health insurance for the first three years sits outside the table9.
Can I retire at 40 with $2 million?
Four percent of $2,000,000 is $80,000 a year (our arithmetic). The catch is the length. The Trinity time horizons were 15, 20, 25 and 30 years6. Retiring at 40 asks for 50 years or more, which that evidence does not cover.
For a horizon that long, the payout annuity formula shows how sensitive the answer is to the real return, the return after inflation8. Worked example (our arithmetic). Inputs: a $2,000,000 start and $80,000 withdrawn each year, with the number of years from the payoff formula on the loan payoff page, n = −ln(1 − P×i/PMT) ÷ ln(1 + i).
| Real return | Years the money lasts |
|---|---|
| 0% | 25.08 |
| 1% | 28.98 |
| 2% | 35.08 |
| 3% | 46.98 |
| 3.5% | 60.48 |
| 4% | Never; the withdrawals equal the return8 |
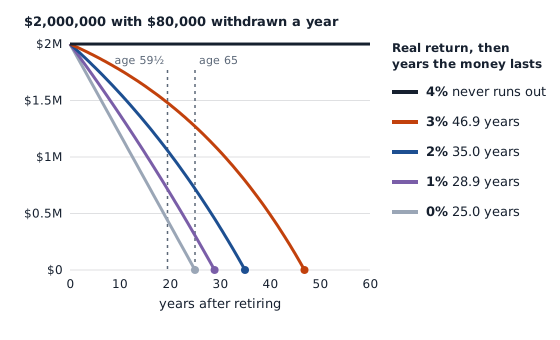
Three rules sit in the gaps of that timeline. Withdrawals from an IRA or retirement plan before age 59½ are early distributions, and an additional 10% tax applies unless an exception does2. One exception is a series of substantially equal payments2. Medicare is 25 years away at 65 (our arithmetic)9. And Social Security is first available at 62, 22 years out (our arithmetic)3.
Work history matters too. Worked example (our arithmetic). Inputs: a wage-indexed $80,000 a year, the 2026 bend points4 and the rule that missing years count as zero3.
| Years worked | AIME | PIA at full retirement age |
|---|---|---|
| 35 | $6,666 | $2,879.0034 |
| 18, from 22 to 40 | $3,428 | $1,842.8034 |
Because fewer than 35 years count as zeros3, 18 years of work earns a PIA that is 64% of the 35-year figure (our arithmetic).
What typical savings look like
The Federal Reserve’s 2022 Survey of Consumer Finances counts retirement accounts such as individual retirement accounts and employer-sponsored accounts like 401(k), 403(b) and thrift savings accounts5. Such accounts were held by 54.3 percent of families in 20225. Among those holding them, the conditional median value was $86,900 and the conditional mean $334,0005.
| Measure (survey of 2022) | Value |
|---|---|
| Families holding a retirement account | 54.3%5 |
| Median balance among holders | $86,9005 |
| Mean balance among holders | $334,0005 |
| Mean IRA and workplace-plan balance, families aged 35 to 64 | $331,4005 |
| Same mean, bottom half by income | $54,7005 |
| Same mean, upper-middle income group | $226,7005 |
| Same mean, top decile by income | $913,3005 |
The mean sits far above the median because a few large balances pull it up. A $1,000,000 balance is above the mean of every group in the table, including the top decile (our arithmetic)5. The survey reports figures for 2022, and balances move with markets.
Mistakes that spoil the number
- Mixing nominal and real dollars. A target in today’s dollars needs a return after inflation10.
- Treating 4% as a promise. It is a historical success rate, and in other countries it failed far more often6.
- Counting Social Security from the wrong age. A claim at 62 pays 70% of the full amount3.
- Forgetting the zero years. Fewer than 35 years of work average in zeros3.
- Forgetting tax. Most retirement plan distributions are subject to income tax2.
- Using the 2026 limits for later years. The IRS resets them annually1.
Next steps
Write down three numbers: yearly spending in today’s dollars, the Social Security estimate from your own statement, and a withdrawal rate you would test, then run them through the calculator above with two different returns. The growth side of the math is in the Rule of 72 and the compound interest formula; the payoff arithmetic is on the loan payoff page. For primary sources, see the IRS’s 2026 limits announcement, the Congressional Research Service’s benefit calculation overview and the Federal Reserve’s Survey of Consumer Finances report.
Common questions
What percentage of people retire with $1,000,000?
The Federal Reserve's 2022 consumer finance survey reports medians and means, not a million-dollar share. Among families holding retirement accounts the median was $86,900 and the mean $334,0005. A balance of $1,000,000 yields $40,000 a year at a 4% rate (our arithmetic,6).
How much do you have to make to get $3,000 a month in social security?
A $3,000 check at full retirement age needs an indexed monthly average near $7,045 across the best 35 years, about $84,500 a year (our arithmetic, 2026 bend points3). Claiming at 62 pays 70% of the full amount, which pushes the needed history far higher3.
Read next
The Rule of 72 Explained: How Fast Money Doubles
Divide 72 by the yearly rate to estimate how long money takes to double. The formula, worked examples, a calculator, an accuracy table and why 72.
Math of moneyCompound Interest Formula: Examples and Calculator
The compound interest formula A = P(1 + r/n)^(nt) with a calculator, worked examples, solving for rate and time, APY and the Rule of 72.
Math of moneyHow Long to Pay Off a Loan: Formula and Calculator
Work out how many months a loan takes to pay off with the loan-term formula, a calculator, worked examples and what extra payments change.
Sources
- 401(k) limit increases to $24,500 for 2026, IRA limit increases to $7,500 · Internal Revenue Service (IR-2025-111) · irs.gov · checked October 21, 2026
- Retirement topics - Exceptions to tax on early distributions · Internal Revenue Service · irs.gov · checked October 21, 2026
- Social Security: Benefit Calculation Overview (CRS In Focus IF11747, updated January 26, 2026) · Congressional Research Service, Library of Congress · congress.gov · checked October 21, 2026
- Cost-of-Living Increase and Other Determinations for 2026, Federal Register, November 3, 2025 · Social Security Administration, via the Federal Register (GovInfo) · govinfo.gov · checked October 21, 2026
- Changes in U.S. Family Finances from 2019 to 2022: Evidence from the Survey of Consumer Finances · Board of Governors of the Federal Reserve System · federalreserve.gov · checked October 21, 2026
- Retirement Withdrawal Rates and Portfolio Success Rates: What Can the Historical Record Teach Us? · Wade D. Pfau, GRIPS, MPRA Paper No. 31122 (Munich Personal RePEc Archive) · mpra.ub.uni-muenchen.de · checked October 21, 2026
- 6.2: Annuities, Math 111: College Algebra · LibreTexts, Highline College (Lippman, Math in Society) · math.libretexts.org · checked October 21, 2026
- 6.3: Payout Annuities, Math 111: College Algebra · LibreTexts, Highline College (Lippman, Math in Society) · math.libretexts.org · checked October 21, 2026
- Original Medicare (Part A and B) Eligibility and Enrollment · Centers for Medicare & Medicaid Services · cms.gov · checked October 21, 2026
- Why does the Federal Reserve aim for inflation of 2 percent over the longer run? · Board of Governors of the Federal Reserve System · federalreserve.gov · checked October 21, 2026
- Mutual Fund and ETF Fees and Expenses · Investor.gov, U.S. Securities and Exchange Commission · investor.gov · checked October 21, 2026
Published . Every source shows the day it was read. Diagrams: original, by the editors. How we check facts · Report an error.