Story · Learning math
Why American Students Struggle With Math: The Data
U.S. math scores plateaued in 2013 and fell after 2019. See the NAEP, PISA and adult-skills numbers, what builds the gaps, and how math anxiety fits in.
In 2024, 39 percent of U.S. fourth graders performed at or above NAEP Proficient in math and 24 percent were below NAEP Basic1. Internationally the U.S. scored 465 in PISA 2022, against an OECD mean of 472 and 575 for Singapore3. Contributors the sources document include cumulative skill gaps5, absenteeism1 and math anxiety3.
- Grade 4, 2024
- 39 percent at or above NAEP Proficient; 24 percent below NAEP Basic1
- PISA 2022
- U.S. 465, OECD mean 472, Singapore 5753
- Adults, 2023
- 34 percent scored Level 1 or below in numeracy, up from 29 percent in 20174
- When the slide began
- NAEP plateaued in 2013 and declined from 20155
- Math anxiety
- One index point goes with 18 fewer PISA score points across OECD countries3
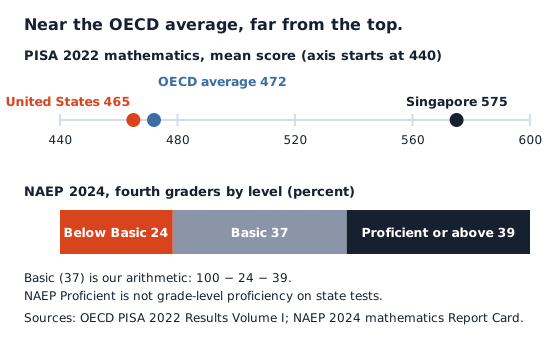
Start with a number that is easy to misread: 39. In 2024, thirty-nine percent of U.S. fourth graders reached the NAEP Proficient level in math1. That is not 39 percent passing. It is a standard set high on purpose, and the same report warns that it is not grade-level proficiency as state tests define it1. The story of why American students struggle with math is mostly a story of reading such numbers carefully, then asking what builds the gaps beneath them.
What the national tests show
NAEP, the Nation’s Report Card, samples students across the country. In 2024 the fourth-grade average score was 2 points higher than in 2022 and 3 points lower than before the pandemic, in 20191. Fourth-grade scores improved compared with 20222. The lowest-performing fourth graders, at the 10th and 25th percentiles, showed no significant score change1.
Eighth grade tells a different story. The average score did not significantly change from 2022, but the spread did: scores rose at the 75th and 90th percentiles and fell at the 10th and 25th2. Hispanic students, economically disadvantaged students, students with disabilities and English learners all had score declines2.
The fourth-grade levels are worth laying out in full.
Worked example (our arithmetic): fourth graders by NAEP level, 20241
| Level | Share | How we got it |
|---|---|---|
| Below NAEP Basic | 24 percent1 | Reported directly1 |
| NAEP Basic, below Proficient | 37 percent1 | 100 − 24 − 391 |
| NAEP Proficient or above | 39 percent1 | Reported directly1 |
So 37 percent of fourth graders sat between the two thresholds1 (our arithmetic). The low group grew since before the pandemic: the share below Basic was 5 percentage points higher than in 2019, and the share at Proficient or above was 2 points lower1.
What country is ranked number one in math?
Singapore. In PISA 2022 it scored 575 in mathematics, significantly higher than every other country and economy that took part3. Hong Kong, Japan, Korea, Macao and Chinese Taipei joined it in outperforming all other systems, six East Asian systems in all3. Finland and Japan led the 2023 adult numeracy survey, at 294 and 2914.
The OECD mean for math was 472 points3. The United States scored 4653, so it performed above the OECD average in science and reading but not in mathematics3.
Worked example (our arithmetic): the gaps in PISA 2022 mathematics points3
| Comparison | Calculation | Gap |
|---|---|---|
| U.S. to OECD mean | 472 − 465 | 7 points3 |
| U.S. to Singapore | 575 − 465 | 110 points3 |
| Singapore to OECD mean | 575 − 472 | 103 points3 |
The first gap is small, and the U.S. score is listed beside twelve countries that were not statistically different from it3. The second is large. The U.S. is near the middle of the pack and far from the top.
What percentage of Americans struggle with math?
The answer depends on which group and which yardstick. Among fourth graders, 24 percent were below NAEP Basic in 20241. Among adults, the 2023 international survey of adult skills counts 34 percent of U.S. adults at Level 1 or below in numeracy, up from 29 percent in 20174. Adults scoring Level 1 or below count as low-performing4.
Worked example (our arithmetic): U.S. adult numeracy, 2017 to 20234
| Measure | 2017 | 2023 | Change |
|---|---|---|---|
| Share at Level 1 or below | 29 percent4 | 34 percent4 | up 5 percentage points4 |
| Average score | 2554 | 2494 | down 6 points4 |
| Gap to the international average of 263 | – | 263 − 249 = 14 points4 | below average4 |
The U.S. average numeracy score of 249 was below the international average of 2634. The United States sat in the lower half of participants, with an average score below 23 other countries4. Numeracy is also the area where the spread is widest: the U.S. gap between the highest and lowest skilled adults is the widest among all countries4. The share of American adults reaching the very top numeracy level has also risen over the past decade4. Averages hide that split, which is why the headline percentage varies by source.
The decline started before the pandemic
The pandemic did not begin the slide. After years of modest gains through the early 2000s, NAEP math achievement began to plateau in 2013 and decline in 20155. Eighth-grade scores then fell more than ever before in 2022, and the 2024 results show no meaningful recovery5. The international data match: PISA trend analysis shows a decades-long decline that began well before the pandemic3, and the OECD average then dropped by almost 15 points in mathematics between 2018 and 20223.
The recovery has been uneven. The lowest-performing students, those at the 10th and 25th percentiles, suffered the steepest and most enduring declines5. Since 1990, the gap between the highest- and lowest-scoring eighth graders on NAEP has grown from 92 to 109 points, an 18% widening5.
Worked example (our arithmetic): how much wider is the gap?
| Step | Calculation | Result |
|---|---|---|
| Increase in points | 109 − 92 | 17 points5 |
| Share of the starting gap | 17 ÷ 92 | about 18.5 percent, which matches the 18% reported5 |
Subgroup gaps are larger still. In 2024, over half of fourth graders with a disability and three quarters of eighth graders with a disability scored Below Basic5.
Why are students struggling with math?
No source here names a single cause. Several contributors recur.
Skills pile on skills. Math learning is “ruthlessly cumulative,” in the words of MIT professor Steven Pinker, quoted in a 2025 report from the Center on Reinventing Public Education5. A student who misses an early idea meets every later one at a disadvantage. The federal National Mathematics Advisory Panel reviewed 16,000 research studies6 and urged schools to focus on whole numbers, fractions, and particular aspects of geometry and measurement as the critical foundations for algebra6. It also urged a coherent progression with emphasis on mastery of key topics and warned against any approach that continually revisits topics without closure6.
Gaps appear early and compound. Girls begin falling behind boys within the first four months of the first year of school5. Harvard’s Martin West compared missing foundational math to skipped retirement savings: a missing deposit does not just create a temporary shortfall, it costs future interest too5. That is the arithmetic of compound interest applied to learning.
Missing school. Student absenteeism in 2024 was lower than in 2022 but higher than the pre-pandemic rate in 20191. Students who miss foundational instruction rarely have a chance to make it up5.
Instruction. Math is highly sensitive to the quality of instruction in schools5. Students in high-needs, high-poverty schools are more likely to have newer and inexperienced teachers, which can lead to further learning difficulties5. The Panel’s content standard for teachers is demanding: elementary teachers need all the critical-foundations topics plus those of an introductory algebra course6.
Poor visibility. Parents and districts cannot respond to gaps they cannot see. Only 18 states clearly broke out math achievement and growth by student subgroup on their report cards5.
Understanding math anxiety
Math anxiety is the part of the story that students can describe in their own words. The PISA index is built from statements such as “I get very nervous doing mathematics problems” and “I feel helpless when doing a mathematics problem”3. Its link to performance is consistent: a negative association between math performance and math anxiety is found in every education system that took part in PISA 2022, without exceptions3.
The size of the link is large enough to measure. On average across OECD countries, a one-point increase in the anxiety index goes with 18 fewer score points after accounting for students’ and schools’ socio-economic profile3. Differences in the index across countries account for about 25% of the variation in student math performance3. This is an association, not proof that anxiety causes the lower scores, and the OECD’s own wording is “associated with”3.
Mindset sits beside it. Anxious students who held a growth mindset, the belief that abilities can be developed over time, scored 461 points; anxious students with a fixed mindset scored 4433.
Worked example (our arithmetic): the mindset gap among anxious students
| Group | PISA math score | Calculation |
|---|---|---|
| Anxious, growth mindset | 4613 | n/a |
| Anxious, fixed mindset | 4433 | n/a |
| Difference | 18 points3 | 461 − 4433 |
Confidence is fragile, and once lost it is hard to regain; many students who do not see themselves as math people decide that by the end of elementary school5. Good instruction that solidifies foundational skills is one of the best ways to prevent math anxiety5.
Anxiety is not the same as a learning disability. Dyscalculia is difficulty acquiring basic arithmetic skills that low intelligence or inadequate schooling does not explain, and about 5% of children in primary schools are affected7. It does not improve without treatment7. The two can feed each other: a negative attitude to arithmetic often develops into a specific math anxiety7.
What the evidence points to
The sources point the same way on a short list. Build the foundations first6. Teach for mastery before moving on6. Keep students in school and in class15. Staff classrooms with teachers who know the content65. Make gaps visible to families5. For readers who want to see how much of this shows up in everyday numbers, what calculus is used for and hidden math in a normal day start from ordinary examples. Every page about learning is in the learning section.
If this left you with a question, start with What Is Calculus Used For? Real-Life Examples or Math in Everyday Life: 7 Examples From One Normal Day.
Sources
- NAEP Mathematics: 2024 Report Card for grades 4 and 8 · The Nation's Report Card (NCES, U.S. Department of Education) · nationsreportcard.gov · checked October 21, 2026
- 2024 Mathematics Grades 4 & 8: Key Findings (summary of results) · The Nation's Report Card (NCES, U.S. Department of Education) · nationsreportcard.gov · checked October 21, 2026
- PISA 2022 Results (Volume I): The State of Learning and Equity in Education · OECD · oecd.org · checked October 21, 2026
- U.S. Adults Score on Par With International Average in Literacy Skills, Below International Average in Numeracy (press release, December 10, 2024) · Institute of Education Sciences, NCES · ies.ed.gov · checked October 21, 2026
- A Crisis in Math: The State of the American Student 2025 · Center on Reinventing Public Education (Arizona State University) · crpe.org · checked October 21, 2026
- Foundations for Success: Final Report of the National Mathematics Advisory Panel (presentation, March 2008) · National Mathematics Advisory Panel, U.S. Department of Education (copy hosted by the Wilson Center) · wilsoncenter.org · checked October 21, 2026
- The Diagnosis and Management of Dyscalculia · Deutsches Arzteblatt International, via PubMed Central (NIH) · pmc.ncbi.nlm.nih.gov · checked October 21, 2026
Published . Every source shows the day it was read. Diagrams: original, by the editors. How we check facts · Report an error.