How it works · Math of money
Rent vs Buy Math: The Formula and a Worked Example
Compare renting and buying with one budget: payment formula, unrecoverable costs, break-even year, the 5%, 2% and 30% rules and a calculator.
Checked against 16 sources (12 textbook, course or government) · By Ambient Math editors
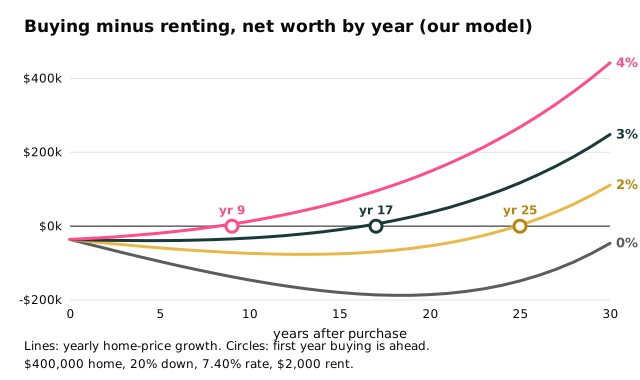
The short answer. Run the same monthly budget through both paths and compare net worth at the year you would sell: buying pays interest, tax and upkeep that never come back, renting gives up the down payment's growth1. On a $400,000 home at the 7.40% market rate, buying leads from year 17 at 3% price growth (our arithmetic)2.
- Mortgage rate
- 30-year fixed averaged 7.40% as of October 15, 20262
- Closing costs
- Typically 2% to 6% of the purchase price3
- Maintenance
- Set aside 1-3 percent of market value a year4
- 5% rule
- Yearly rent under 5% of a similar home's value favors renting1
- 30% rule
- Housing costs above 30% of income mean cost burden5
- Example result
- $400,000 home, $2,000 rent: buying leads from year 17 at 3% growth (our arithmetic)2
On this page
- How to calculate buying vs renting
- Worked example: a $400,000 home against $2,000 rent
- When does buying pull ahead?
- How the mortgage rate moves the break-even year
- What is the 5% rule for renting vs. buying?
- What is the 2% rule for rentals?
- What is the 30% rule for rent?
- Taxes: mortgage interest vs the standard deduction
- Costs that tip the horizon
Rent and a mortgage payment cannot be compared directly. Part of each mortgage payment buys equity back, part of the rent pays for a roof and a plumber, and the down payment could have been earning something else. The comparison that works adds up what each path costs for good and what each path leaves you with when the horizon ends. Below: the payment formula, a fully worked example with round numbers, the year buying pulls ahead under four price-growth cases, how the mortgage rate moves that year, the three popular percentage rules of thumb, and a calculator. The money section has the neighbouring formulas.
How to calculate buying vs renting
A fair comparison runs the same budget through two paths and counts what each ends with. Mortgage payment and rent are only the start.
- Find the monthly principal and interest. Lenders calculate it with a standard mathematical formula from the loan amount, the term and the interest rate6. For a mortgage loan of $100,000 over 30 years at four percent, it is $477 a month6.
- Add what owning costs besides the loan. The total monthly payment often includes homeowners' insurance and taxes on top of principal and interest6. Maintenance and repair costs come on top of that4.
- Count the cash needed up front. The down payment plus closing costs, which typically run 2% to 6% of the purchase price3.
- Give the renter the same budget. The renter invests the down payment and closing money at the start, and invests each month whatever owning would have cost above the rent.
- Compare net worth at the end of the horizon. The owner has the home's value, less the selling costs and the mortgage balance. The renter has the invested pile.
The principal-and-interest formula is M = P × r ÷ (1 − (1 + r)^−n), where P is the loan, r the monthly rate (the yearly rate divided by 12) and n the number of monthly payments6.
Worked example (our arithmetic). Inputs: the loan of $100,000 over 30 years at 4% that gives $4776.
| Step | Calculation | Result |
|---|---|---|
| Monthly rate | 4% ÷ 12 | 0.3333%6 |
| Number of payments | 30 × 12 | 3606 |
| Payment | 100,000 × 0.003333 ÷ (1 − 1.003333^−360) | $477.42 a month, matching the $4776 |
Worked example: a $400,000 home against $2,000 rent
The home price and rent below are round numbers chosen for the example, and every other input is stated. The mortgage rate is the current market: the 30-year fixed-rate mortgage averaged 7.40% as of October 15, 2026, against 6.27% a year earlier2. The survey behind that figure is based on rates from thousands of loan applications submitted to Freddie Mac2. All figures that follow are our arithmetic.
| Input | Value | Where it comes from |
|---|---|---|
| Home price | $400,000 | Round number, loan basis for the payment formula6 |
| Down payment | 20%, or $80,000 | Assumption; loan is the rest6 |
| Mortgage | $320,000, 30 years, 7.40% | Rate: market average2 |
| Closing costs | 3%, or $12,000 | Inside the 2% to 6% range3 |
| Property tax | 1.0% of value a year | Inside the 0.29% to 1.88% range of state effective rates7 |
| Maintenance | 1.0% of value a year | Low end of the 1% to 3% a year range4 |
| Insurance, utilities, HOA | Not included | No sourced rate; the calculator’s ownership-cost input can carry them |
| Rent | $2,000 a month, rising 3% a year | Assumption, compounded yearly8 |
| Investments | 5% a year, compounded monthly | Assumption for both sides’ savings8 |
| Home price growth | 0%, 2%, 3% or 4% a year | Scenarios, compounded8 |
| Selling costs | 6% of the sale price | Assumption; agent fees alone typically run 3 to 7 per cent in Canada1 |
The effective property tax rate is total real taxes paid divided by total home value7. In 2024 it ranged from 0.29% in Hawaii to 1.88% in New Jersey, with Colorado at 0.50%7. Housing experts recommend setting aside 1-3 percent of a home’s market value each year for maintenance and repair costs4. Those funds cover large future expenses such as a new heating and air conditioning unit or a roof4.
Worked example (our arithmetic). Monthly costs at purchase, inputs above674.
| Item | Calculation | Monthly cost |
|---|---|---|
| Principal and interest | $320,000 at 7.40% over 30 years | $2,215.626 |
| Property tax | 400,000 × 1.0% ÷ 12 | $333.337 |
| Maintenance | 400,000 × 1.0% ÷ 12 | $333.334 |
| Owner total | $2,882.286 | |
| Rent | $2,000.008 | |
| Difference | 2,882.28 − 2,000 | $882.28 a month more to own6 |
Cash needed at the start is $80,000 plus closing costs: $88,000 at the 2% end of the range, $92,000 at 3% and $104,000 at the 6% end (our arithmetic)3.
Here is the first year’s cost of owning that never comes back, set against appreciation (our arithmetic). The interest on a $320,000 loan at 7.40% is $23,579 in year one, and the 5% annual return on the $92,000 tied up is the money the owner gives up by not investing it6.
| Item (year one) | Calculation | Cost |
|---|---|---|
| Mortgage interest | Twelve payments, interest part only | $23,5796 |
| Property tax | 400,000 × 1.0% | $4,0007 |
| Maintenance | 400,000 × 1.0% | $4,0004 |
| Return given up on cash | 92,000 × 5% | $4,6003 |
| Total that does not come back | $36,179, or 9.04% of the price6 | |
| Home price growth at 3% | 400,000 × 3% | −$12,0008 |
| Net cost of owning | 36,179 − 12,000 | $24,179, or 6.04% of the price6 |
| Rent for the year | 2,000 × 12 | $24,000, or 6.00% of the price8 |
At 3% price growth the net cost of owning for the first year, $24,179, is almost the same as the $24,000 of rent (our arithmetic)8. Smaller growth tips the first year toward renting and larger growth tips it toward buying8.
When does buying pull ahead?
Buying starts behind, because of closing costs and the selling costs that come out of the sale price, and it catches up as the loan balance falls and the home gains value. Transaction costs can easily erase any gains from an increase in the value of your home if you sell less than five years after moving in1.
Worked example (our arithmetic). Buyer’s net worth minus renter’s net worth, with the example inputs, after the number of years in the first column. A negative number means renting leaves more2347.
| Years | 0% growth | 2% growth | 3% growth | 4% growth8 |
|---|---|---|---|---|
| 3 | −$72,636 | −$50,362 | −$38,886 | −$27,1828 |
| 5 | −$95,751 | −$58,796 | −$39,170 | −$18,7478 |
| 7 | −$117,399 | −$65,991 | −$37,834 | −$7,9308 |
| 10 | −$146,163 | −$73,714 | −$32,103 | $13,5018 |
| 15 | −$179,685 | −$74,822 | −$9,346 | $66,4778 |
| 30 | −$46,501 | $111,260 | $248,140 | $442,2448 |
The first year buying is ahead is year 9 at 4% growth, year 17 at 3% and year 25 at 2%, and not within 30 years at 0% (our arithmetic)2.
The yearly price growth is the least certain input, and the Federal Reserve’s longer-run inflation goal of 2 percent, measured by the personal consumption expenditures price index, gives the 2% case a reference point as flat in real terms9. Over the long term, stocks have historically yielded better returns than real estate, though home prices can rise faster than stocks in any given year1. The model assumes the renter earns 5% and the owner’s home grows 0% to 4% (our assumptions), so the answer moves with both.
How the mortgage rate moves the break-even year
The same home, rent and assumptions with different mortgage rates (our arithmetic). The 6.27% row is the rate a year before the October 15, 2026 survey2.
| Mortgage rate | Principal and interest | First year buying leads at 3% growth | First year buying leads at 4% growth |
|---|---|---|---|
| 5.00% | $1,717.83 | Year 56 | Year 46 |
| 6.00% | $1,918.56 | Year 86 | Year 56 |
| 6.27% | $1,974.46 | Year 92 | Year 52 |
| 7.00% | $2,128.97 | Year 136 | Year 76 |
| 7.40% | $2,215.62 | Year 172 | Year 92 |
Moving from 6.27% to 7.40% adds $241.16 to the monthly payment on the same loan (our arithmetic)26. That pushes the 3% break-even from year 9 to year 17.
What is the 5% rule for renting vs. buying?
The 5% rule compares the unrecoverable costs of renting and owning1. If a year’s worth of rent adds up to less than 5% of the value of a similar home, being a tenant is financially attractive, and if the rent is more than 5%, owning might be worth considering1. The reasoning is that interest on a mortgage and property taxes do not build home equity, so they count as costs that do not come back1.
Worked example (our arithmetic). Inputs: $2,000 a month of rent and a $400,000 home1.
| Check | Calculation | Result |
|---|---|---|
| Yearly rent | 2,000 × 12 | $24,0001 |
| Home value that matches 5% | 24,000 ÷ 0.05 | $480,0001 |
| Rent as a share of this $400,000 home | 24,000 ÷ 400,000 | 6.00%1 |
The rule’s own example is the same rent: $24,000 a year is 5% of $480,0001. At 6.00% the rule leans toward owning for a $400,000 home. Our year-one table shows why the 5% is an assumption and not a constant: at a 7.40% mortgage rate the costs that do not come back were 9.04% of the price before price growth, and 6.04% after 3% growth (our arithmetic)26. The threshold moves with the mortgage rate.
What is the 2% rule for rentals?
Rental investors use the 2% rule as a screen, and it does not test renting against buying10. The rule advises that for an investment property to have positive cash flow, the monthly rent should equal or exceed two percent of the purchase price10. A $200,000 property needs $4,000 of monthly rent10. It is a fast way to guess cash flow potential and a benchmark when evaluating investments10.
Worked example (our arithmetic). Inputs: the $400,000 home and the 2% rule10.
| Check | Calculation | Result |
|---|---|---|
| Rent the 2% rule asks for | 400,000 × 0.02 | $8,000 a month10 |
| Rent in our example | 2,000 ÷ 400,000 | 0.50% of the price10 |
The 0.50% is a quarter of the 2% the rule asks for (our arithmetic)10. A screen built for cash flow on rentals leaves out whether living in a home beats renting one.
What is the 30% rule for rent?
The 30% rule is an affordability yardstick, not a break-even test. A household is cost burdened when monthly housing costs, utilities included, exceed 30% of monthly income, and severely cost burdened above 50%5. It applies to renters and owners alike.
Worked example (our arithmetic). Inputs: the monthly costs from the example, utilities left out5.
| Housing cost | Calculation | Yearly income at which it is 30% |
|---|---|---|
| Rent $2,000 | 24,000 ÷ 0.30 | $80,0005 |
| Owning, $2,882.28 | 34,587 ÷ 0.30 | $115,2915 |
Utilities, insurance and association dues would raise both figures, since the definition counts utilities5.
Taxes: mortgage interest vs the standard deduction
Interest and points on a loan secured by a main or second home count as qualified mortgage interest (IRS Topic 505)11. It is deductible only as an itemized deduction on Schedule A11. For homes acquired after December 15, 2017 the debt limit is $750,000, or $375,000 if married filing separately11. State and local taxes are capped at $40,000 ($20,000 if married filing separately)12. Itemizing pays only when allowable itemized deductions exceed the standard deduction13.
Worked example (our arithmetic). Year-one itemized total: $23,579 of interest plus $4,000 of property tax, $27,5791112. The 2026 standard deduction is $16,100 for single filers and $32,200 for married couples filing jointly14.
| Filing status | Itemized $27,579 against standard | Extra deduction from owning |
|---|---|---|
| Single | $27,579 − $16,100 | $11,47914 |
| Married filing jointly | $27,579 − $32,200 | None; $4,621 below the standard deduction14 |
A single filer with a 22% marginal rate would save 22% × $11,479 = $2,525 in federal tax in year one (our arithmetic)13. The tax bracket page shows how a deduction turns into tax saved at each marginal rate.
Costs that tip the horizon
Closing costs can include loan origination fees, discount points, the appraisal fee, survey, title insurance, legal fees and prepaid taxes and insurance3. They typically run 2% to 6% of the purchase price3. A home sale can exclude up to $250,000 of gain from income, or $500,000 on a joint return (IRS Topic 701)15. To qualify the owner must have owned and used the home for at least 24 months out of the last 5 years15.
In the example the home is worth $537,567 after 10 years at 3% growth, a gain of $137,567 over the $400,000 price, which is under the $250,000 limit before counting costs (our arithmetic)15. In the Federal Reserve’s 2022 Survey of Consumer Finances the homeownership rate was 66.1 percent, and the median net housing value of families that owned a home was $201,00016.
Try your own numbers
Rent vs buy calculator
Monthly model with the assumptions on this page. Edit any input. Nothing you type leaves this page.
- Mortgage principal and interest
- –
- Owner's monthly cost
- –
- Owner's net worth after selling
- –
- Renter's invested pile
- –
- Result
- –
The defaults reproduce the 10-year, 3%-growth row of the table above, with a 30-year fixed loan26. The calculator ignores income taxes on investment returns, utilities and any mortgage-interest tax benefit, and it leaves rent control, job moves and the pleasure of owning out of the arithmetic. It compares dollars and is not advice to rent or to buy.
For the payment formula in more detail, see the loan payment formula; for the cost of a loan expressed as a yearly rate, APR vs APY; and for how long a balance takes to clear, how long it takes to pay off a loan. The CFPB’s mortgage payment explainer and HUD’s housing counselor glossary are the government sources for the payment and closing-cost figures above.
Read next
Loan payment formula, step by step
The fixed monthly loan payment formula, a calculator, where it comes from, worked examples and common mistakes.
Math of moneyHow US Income Tax Brackets Work: 2026 Rates and Examples
Each bracket taxes only the slice of income inside it. IRS 2026 and 2025 tables for every filing status, a $100,000 example and a calculator.
Math of moneyAPR vs APY: The Difference, With the Math and Examples
APR is the yearly rate before compounding; APY is the rate after it. See the formula, 5% and 24% examples, a calculator and how loan fees change APR.
Sources
- Renting vs. buying a home: the 5% rule · The Globe and Mail · theglobeandmail.com · checked October 21, 2026
- Mortgage Rates: Primary Mortgage Market Survey, as of October 15, 2026 · Freddie Mac · freddiemac.com · checked October 21, 2026
- Housing Counselors Training Study Guide Glossary · U.S. Department of Housing and Urban Development · hudhousingcounselors.hud.gov · checked October 21, 2026
- Preventative Home Maintenance · North Carolina State University, NC Cooperative Extension · content.ces.ncsu.edu · checked October 21, 2026
- CHAS: Background (cost burden definition) · U.S. Department of Housing and Urban Development, HUD User · huduser.gov · checked October 21, 2026
- How do mortgage lenders calculate monthly payments? · Consumer Financial Protection Bureau · consumerfinance.gov · checked October 21, 2026
- Property Taxes by State and County, 2026 · Tax Foundation, from U.S. Census Bureau American Community Survey data · taxfoundation.org · checked October 21, 2026
- 6.4 Compound Interest, Contemporary Mathematics · OpenStax (Rice University) · openstax.org · checked October 21, 2026
- Why does the Federal Reserve aim for inflation of 2 percent over the longer run? · Board of Governors of the Federal Reserve System · federalreserve.gov · checked October 21, 2026
- What is the 2% Rule in Real Estate? · Arrived · arrived.com · checked October 21, 2026
- Topic no. 505, Interest expense · Internal Revenue Service · irs.gov · checked October 21, 2026
- Topic no. 503, Deductible taxes · Internal Revenue Service · irs.gov · checked October 21, 2026
- Topic no. 501, Should I itemize? · Internal Revenue Service · irs.gov · checked October 21, 2026
- IRS releases tax inflation adjustments for tax year 2026, including amendments from the One, Big, Beautiful Bill · Internal Revenue Service · irs.gov · checked October 21, 2026
- Topic no. 701, Sale of your home · Internal Revenue Service · irs.gov · checked October 21, 2026
- Changes in U.S. Family Finances from 2019 to 2022: Evidence from the Survey of Consumer Finances · Board of Governors of the Federal Reserve System · federalreserve.gov · checked October 21, 2026
Published . Every source shows the day it was read. Diagrams: original, by the editors. How we check facts · Report an error.