Reference · Math in the world
Polar Rose Curves: Equation, Petals and Math Flowers
The rose curve r = a cos(kθ) draws a flower. See the petal rule for whole and fractional k, sine versus cosine, and the area of a rose, worked out.
Rev. · 7 refs · 5 textbook or government · Ambient Math editors
A rose curve is the polar graph of r = a cos(kθ) or r = a sin(kθ)1. When k is a whole number, the graph has twice as many petals as the coefficient if it is even, and as many petals as the coefficient if it is odd5. Rational values of k give closed roses and irrational values never close5.
- Equation
- r = a cos(kθ) or r = a sin(kθ), plotted in polar coordinates1
- Whole k
- 2k petals if k is even, k petals if k is odd (our arithmetic from the rule)5
- Size
- The rose is inscribed in the circle r = a1
- Sine versus cosine
- The sine rose is the cosine rose turned; the cosine rose puts a petal to the right12
- Irrational k
- Infinitely many petals, never completes1
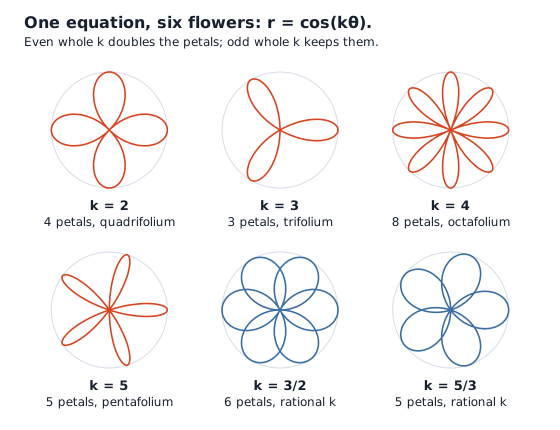
A one-line equation can draw a flower. Plot the cosine of a multiple of an angle, but measure the result as a distance from the center instead of a height above a line, and the wave curls into petals. The Italian mathematician Guido Grandi studied these curves between 1723 and 1728 and named them rhodonea, after the rose1. Below: the equation, the rule that counts the petals, a worked area, and the loop that draws one on a screen.
What is the polar equation for a rose curve?
A rose, or rhodonea curve, is a sinusoid with no phase angle, specified by either the cosine or the sine function and plotted in polar coordinates1. The usual form is r = a cos(kθ), or r = a sin(kθ) for the sine version1. Two numbers shape the flower. The constant a sets the size, because the rose is inscribed in the circle r = a and every petal tip lies on that circle1. The constant k, the angular frequency, sets the number of petals1.
The curve is a plain wave drawn in a different space. Rose curves are drawn using polar coordinates, not Cartesian ones4. The wave swings between positive and negative values, and the radius follows it out and back in.
Polar coordinates in one paragraph
The polar coordinate system is an alternative way of mapping points to ordered pairs5. The first coordinate is the radial coordinate and the second is the angular coordinate5. The center point is the pole, or origin, and the ray running to the right is the polar axis5. Positive angles are measured counterclockwise and negative angles clockwise5. A curve is graphed in the same way as in rectangular coordinates, from a function r = f(θ)5. Start from a list of values of θ, compute r for each, and plot the resulting ordered pairs5.
How many petals does a rose curve have?
Count by the type of k. Graphs of roses are composed of petals, and a petal is the shape formed by one half-cycle of the sinusoid1.
| Value of k | Petals | Example | Source |
|---|---|---|---|
| Even whole number | Twice as many as the coefficient5 | k = 4 gives a rose with 8 petals, an octafolium1 | 15 |
| Odd whole number | As many as the coefficient5 | k = 5 gives 5 petals, a pentafolium1 | 15 |
| Fraction n over d, in lowest terms | n if n and d are both odd, otherwise twice n (our arithmetic)1 | See the worked table below | 1 |
| Irrational | An infinite number, and the curve never completes1 | 1 |
The named whole values follow one pattern. A rose with k = 1 is a circle on the pole with its diameter on the polar axis, a single petal1. The next ones are named for their petals1:
| k | Name | Petals | Shape traced by the tips |
|---|---|---|---|
| 2 | Quadrifolium | 41 | A square1 |
| 3 | Trifolium | 31 | An equilateral triangle1 |
| 4 | Octafolium | 81 | An octagon1 |
| 5 | Pentafolium | 51 | A regular pentagon1 |
| 6 | Dodecafolium | 121 | A dodecagon1 |
Connecting the tips of the petals gives a regular polygon1. Whole k gives petals that do not cross each other, and any other k gives petals that intersect1.
Why do even and odd k give different counts?
Every petal has a tip where r reaches a or −a4. The peaks of the petals are the points furthest from the pole4. A point with negative radius is plotted on the opposite side of the pole, so a negative half-cycle can land on top of a positive one41.
Worked example (our arithmetic): peaks of the cosine rose over one full turn
| k | Peaks of the wave in one turn | Do negative peaks overlap positive ones? | Petals drawn |
|---|---|---|---|
| 4 | 2 × 4 = 8 | No, each lands on a new direction | 81 |
| 3 | 2 × 3 = 6 | Yes, each flips onto a positive peak | 31 |
For even k, the 8 peaks of k = 4 sit in 8 different directions, one petal each1. For odd k, the negative peaks flip onto the directions of the positive ones, so the 6 peaks of k = 3 collapse into 3 petals1. The negative-radius convention does the work: a point with negative radius is the same point as one with the same positive radius in the opposite direction from the pole4.
For odd k, the positive and negative half-cycles coincide, so only one kind needs plotting to form the full curve1.
How to tell a sine rose from a cosine rose
The sine rose r = a sin(kθ) is the same rose as r = a cos(kθ), rotated counterclockwise1. Both are the same curve turned, so the petal count is identical. The difference is the direction.
- The cosine rose is symmetric about the polar axis1.
- The sine rose is symmetric about the vertical line through the pole1.
- The cosine orientation gives a petal oriented to the right2.
For a whole number k, the cosine and sine roses are never coincident1. All petals of a rose are rotations of one petal about the pole1, and the petals share one shape because each is a half-cycle of the same wave1.
Fractions and irrational values of k
When k is a rational number, the curve is closed, meaning it eventually ends where it started5. When k is irrational, the curve never closes5. Roses with irrational k form a dense set, coming arbitrarily close to every point of the disk r ≤ a1.
For a fraction k = n/d in lowest terms, the number of petals is n when n and d are both odd, and twice n otherwise1.
Worked example (our arithmetic): petals for rational k
| k = n/d | n odd and d odd? | Petals |
|---|---|---|
| 3/2 | No, d is even | 2 × 3 = 61 |
| 5/3 | Yes | 51 |
| 4/3 | No, n is even | 2 × 4 = 81 |
| 7/2 | No, d is even | 2 × 7 = 141 |
Each count was checked against a numeric plot of the curve (peaks on the circle r = a, grouped by direction), and all 4 agree with the rule (our arithmetic)1.
Two fractions have names. A rose with k = 1/2 is the Dürer folium, a trisectrix, a curve that can be used to trisect angles1. The curve with k = 3 is also called the Paquerette de Mélibée1.
Worked example: how much area does a rose cover?
Counting petals is one way to size a rose, and area is another. The popular game of “he loves me, he loves me not” could be played on a rose by calculating its area rather than counting petals1. OpenStax finds the area of one petal of the rose r = 3 sin 2θ6. Here is the same calculation set out in steps.
Worked example (our arithmetic): area of one rose, from the OpenStax setup
| Step | Calculation | Result |
|---|---|---|
| Petals, from the rule for even k | 2 × 2 | 4 petals5 |
| One petal runs from θ = 0 to θ = π/2, where r first returns to 0 | 3 sin 2θ = 0 | θ = π/26 |
| Area of one petal | ½ ∫ 9 sin²2θ dθ from 0 to π/2, with sin²2θ = (1 − cos 4θ)/2 | 9π/8, about 3.536 |
| Area of all 4 petals | 4 × 9π/8 | 9π/2, about 14.146 |
| Area of the circle r = 3 around it | π × 3² | 9π, about 28.271 |
| Share of the circle that the rose covers | 14.14 ÷ 28.27 | one half1 |
This rose covers exactly half of the circle it is inscribed in (our arithmetic)1.
Make your own flower in code
A short program can draw these curves. The Ohio State project starts from one idea: make the radius depend on the angle7. Each pass through the loop moves θ forward by a small step and plots a point7. The shapes that come out look like roses, and some look like daisies7.
Worked example (our arithmetic): how long a full turn takes in that program
| Quantity | Calculation | Result |
|---|---|---|
| Step in θ per iteration | given | 0.001 radians7 |
| Iterations per second | given | 607 |
| Iterations for one full turn of 2π | 2π ÷ 0.001 | about 6,2837 |
| Time for one turn | 6,283 ÷ 60 | about 105 seconds7 |
A larger step draws faster and a smaller one draws smoother, and the petal counts can be compared with the rule above.
Where did the name come from?
Grandi named the curves rhodonea because they looked like roses3. He was a member of the Camaldolite order, professor of philosophy at the University of Pisa from 1700 and professor of mathematics there from 17143. His geometry work looked at analogies of the circle and the equilateral hyperbola3. The curves have fascinated mathematicians since4. Another name for them is Grandi’s rose, or the multifolium2.
Where to go next
The polar plotting rules are in the open textbook sections on polar coordinates and area in polar coordinates. The history is at MacTutor, and the code project is at Ohio State.
The same sine and cosine waves power the other curves in the Math in the world section. Pi appears in every area above, as covered on what pi is. For another case where one scale factor changes shape, see how much Godzilla would eat, and for waves in a different setting, why power lines use high voltage.
Common questions
What is the polar equation of a curve?
It is an equation that gives the radial distance r from the pole for each angle θ, written r = f(θ)5. To graph it, tabulate values of θ, compute r for each, and plot the ordered pairs in the polar coordinate system5.
RelatedWhat Is Pi? Meaning, Value, Uses and HistoryGodzilla and the Square-Cube Law: How Big Can Animals Get?Why Power Lines Use High Voltage: The Math of Line Loss
Sources
- Rose (mathematics) · Wikipedia · en.wikipedia.org · checked October 22, 2026
- Rose Curve (Wolfram MathWorld) · Wolfram MathWorld · mathworld.wolfram.com · checked October 22, 2026
- Rhodonea Curves (MacTutor History of Mathematics) · University of St Andrews · mathshistory.st-andrews.ac.uk · checked October 22, 2026
- Counting rose petals (J. Eckhart) · Plus Magazine, University of Cambridge · plus.maths.org · checked October 22, 2026
- 7.3 Polar Coordinates (Calculus Volume 2) · OpenStax · openstax.org · checked October 22, 2026
- 7.4 Area and Arc Length in Polar Coordinates (Calculus Volume 2) · OpenStax · openstax.org · checked October 22, 2026
- Mathematical Flowers (math coding project) · The Ohio State University · asc.ohio-state.edu · checked October 22, 2026
Published . Every source shows the day it was read. Diagrams: original, by the editors. How we check facts · Report an error.