Reference · Math of health
Resting Metabolic Rate Formulas: Mifflin-St Jeor and More
The resting metabolic rate formulas side by side: coefficients, who each was built on, worked example and how far they disagree and miss.
Rev. · 11 refs · 9 textbook or government · Ambient Math editors
The most widely validated resting metabolic rate formula is Mifflin-St Jeor: 10 × weight (kg) + 6.25 × height (cm) − 5 × age (years), plus 5 for men or minus 161 for women1. A systematic review found it landed within 10% of measured rate for more adults than any other common equation2.
- Mifflin-St Jeor (1990)
- 498 healthy adults, ages 19 to 781
- Harris-Benedict (1919)
- 239 normal subjects; 14% precision3
- Fat-free-mass form
- 370 + 21.6 × FFM4
On this page
- What is BMR?
- The general shape: a line in weight, height and age
- What is the Mifflin-St Jeor equation?
- Why Mifflin-St Jeor replaced Harris-Benedict
- Harris-Benedict, Katch-McArdle and FAO: the other formulas
- Worked example: five equations, one woman
- How much does each input matter?
- How accurate are the formulas for one person?
- Choosing a formula: populations and limits
- Mistakes with the formulas
- What next
The common resting metabolic rate formulas are fitted straight lines. Researchers measure the energy of a few hundred people, then find the weights, heights and ages that best predict it. Which line you get depends on who was measured and which inputs were allowed. This page lays the lines side by side, with the original papers, the populations behind them and the errors they carry. The subject is formulas, not personal needs. The health section has the related math, and the total daily energy expenditure page shows what happens after the resting step.
What is BMR?
Basal metabolic rate, BMR, is the amount of energy used to simply stay alive in the absence of any physical activity10. Strictly, it is measured under standard conditions: awake and lying down, 10 to 12 hours after a meal, after 8 hours of physical rest6. Resting metabolic rate, RMR, and resting energy expenditure, REE, are looser terms for the same quantity, more specific to rest10. The formulas on this page predict that quantity, in kilocalories a day (kcal/day).
BMR is the largest part of the daily energy budget. One reference puts it at about 45 to 70 percent of total energy expenditure in adults, set mainly by sex, body size, body composition and age6. A validation study narrows it to 60% to 70% in sedentary adults8. The gold standard for measuring it is indirect calorimetry, which is costly and needs trained staff8. BMR can be measured only under laboratory conditions and in small groups of representative individuals6, so almost everyone uses an equation instead.
The general shape: a line in weight, height and age
The formulas form a family, and the most common shape is a straight line in weight, height and age with one intercept for each sex: RMR = a × weight + b × height − c × age + d.
The coefficients below come from the original papers and from open-access tables that reprint them17. Weight is in kilograms, height in centimeters and age in years. The result is kcal/day.
| Equation | Sex | Weight (a) | Height (b) | Age (c) | Intercept (d) |
|---|---|---|---|---|---|
| Mifflin-St Jeor, 1990 | men | 10 | 6.25 | 5 | +51 |
| Mifflin-St Jeor, 1990 | women | 10 | 6.25 | 5 | −1611 |
| Harris-Benedict, 1919 | men | 13.7516 | 5.0033 | 6.755 | +66.4737 |
| Harris-Benedict, 1919 | women | 9.5634 | 1.8496 | 4.6756 | +655.09557 |
Two more families skip height and age. The Schofield equations, which the FAO/WHO/UNU consultation kept in its report, use body weight alone, with separate lines for each age band6. The fat-free-mass equations use body composition instead, and they appear below. Four equations were identified as the most commonly used in clinical practice: Harris-Benedict, Mifflin-St Jeor, Owen and the WHO/FAO/UNU set2.
What is the Mifflin-St Jeor equation?
Mifflin-St Jeor is a regression fitted to 498 healthy adults, 247 women and 251 men, aged 19 to 781. Of them, 264 were normal weight and 234 were obese, and their resting energy was measured by indirect calorimetry1. The full-precision fit is REE = 9.99 x weight + 6.25 x height - 4.92 x age + 166 x sex - 161, with sex coded 1 for males and 0 for females1. It explains a share of the variance equal to R2 = 0.711. Rounding the coefficients and splitting the equation by sex gave the two familiar lines, and that simplification did not affect its predictive value1.
The sex term is worth 166 kcal a day between the two forms, because +5 minus −161 is 1661. Adding relative body weight or body-weight distribution did not significantly improve the prediction1.
Why Mifflin-St Jeor replaced Harris-Benedict
The Harris-Benedict equations came from a study by Harris and Benedict, published in 1919 by the Carnegie Institution of Washington11. They were derived from indirect calorimetric data in 239 normal subjects3. A 1984 reanalysis added later data and found regression equations similar to the originals3. It put the precision at 14% for a normal subject3. The same paper found the equations unreliable in the malnourished patient3.
Decades after 1919, the Mifflin team measured a new sample and compared. In their data the 1919 equations overestimated measured resting energy by 5%1. The Mifflin sample included obese adults, who were part of the design from the start1. Later, a review of the literature on healthy nonobese and obese adults compared the four common equations and found Mifflin-St Jeor the most reliable (systematic review): it predicted RMR within 10% of the measured value in more individuals than any other equation, and it also had the narrowest error range2. That result, not fashion, is why calculators moved to it.
| Year | Equation | Built on | Evidence |
|---|---|---|---|
| 1919 | Harris-Benedict | 239 normal subjects3; derived in 19191 | 14% precision for a normal subject3 |
| 1980 | Cunningham, lean body mass | 223 subjects from the 1919 data5 | lean body mass was the single predictor5 |
| 1990 | Mifflin-St Jeor | 498 adults, normal weight and obese1 | within 10% for more people than the rest2 |
| 1991 | Cunningham, fat-free mass | synthetic review of body-composition studies4 | explains 65-90% of the variation4 |
Harris-Benedict, Katch-McArdle and FAO: the other formulas
Fat-free-mass equations. Cunningham found in 1980, using 223 subjects from the original Harris and Benedict data, that lean body mass alone predicted resting rate, and proposed BMR (cal/day) = 500 + 22 (LBM)5. In that analysis the influences of sex and age added little5. His 1991 synthetic review settled on REE = 370 + 21.6 x FFM4. This version is usually called the Katch-McArdle formula, and the two are the same equation9. It confirms a primary correlation between REE and fat-free mass across a broad range of body weights4. A separate fat-mass term was not supported in the general population4.
Mifflin’s own fat-free-mass line. The Mifflin data found fat-free mass the best single predictor of REE, with R2 = 0.64 and REE = 19.7 x FFM + 4131. Weight alone did almost as well, with R2 = 0.56 and REE = 15.1 x weight + 3711. That is the reason weight-based equations work at all: body weight is a rough stand-in for the fat-free mass that does the burning.
FAO/WHO/UNU (Schofield). The FAO/WHO/UNU consultation kept the equations proposed in 1985 by Schofield6. They were derived mostly from studies in Western Europe and North America6. The adult rows are below, in kcal/day. Each row is a line in body weight alone, and the second number is the standard error of the estimate (the “see” column of the source table):
| Age band | Men | Women |
|---|---|---|
| 18-30 | 15.057 × kg + 692.2 (see 153)6 | 14.818 × kg + 486.6 (see 119)6 |
| 30-60 | 11.472 × kg + 873.1 (see 167)6 | 8.126 × kg + 845.6 (see 111)6 |
| 60 and over | 11.711 × kg + 587.7 (see 164)6 | 9.082 × kg + 658.5 (see 108)6 |
No validation work focused on individual errors was found for the WHO/FAO/UNU equation2.
Worked example: five equations, one woman
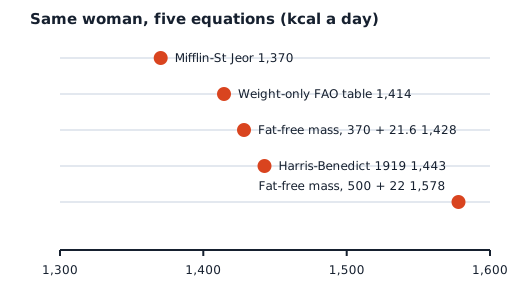
Take a 40-year-old woman, 70 kg, 165 cm. For the fat-free-mass lines assume 30% body fat, so 49 kg of fat-free mass; that assumption is ours, not a measurement. The coefficients are the ones in the tables above14567.
Worked example (our arithmetic)
| Equation | Calculation | Result (kcal/day) |
|---|---|---|
| Mifflin-St Jeor | 10 × 70 + 6.25 × 165 − 5 × 40 − 161 = 700 + 1,031.25 − 200 − 1611 | 1,370 |
| FAO weight-only, women 30-60 | 8.126 × 70 + 845.66 | 1,414 |
| Fat-free mass, 370 + 21.6 | 370 + 21.6 × 494 | 1,428 |
| Harris-Benedict 1919 | 655.0955 + 9.5634 × 70 + 1.8496 × 165 − 4.6756 × 407 | 1,443 |
| Fat-free mass, 500 + 22 | 500 + 22 × 495 | 1,578 |
The five answers span 208 kcal a day, from 1,370 to 1,578 (our arithmetic). The first four sit within about 5% of each other, and the 1980 line sits above the rest. The spread is the point. No equation is the truth for this woman. The full spread is about 15% of the lowest value (our arithmetic), the same order as the 14% precision found for Harris-Benedict3.
The same comparison for a 40-year-old man at 80 kg and 180 cm167:
| Equation | Result (kcal/day) |
|---|---|
| Mifflin-St Jeor: 10 × 80 + 6.25 × 180 − 5 × 40 + 5 | 1,7301 |
| FAO (30-60, M): 11.472 × 80 + 873.1 | 1,7916 |
| Harris-Benedict: 66.473 + 13.7516 × 80 + 5.0033 × 180 − 6.755 × 40 | 1,7977 |
How much does each input matter?
A fitted line has one slope per input, and the slope is the derivative of the prediction with respect to that input. That makes the comparison simple: look at the coefficients.
| Equation | Per extra kg | Per extra cm | Per extra year of age |
|---|---|---|---|
| Mifflin-St Jeor | +101 | +6.251 | −51 |
| Harris-Benedict, women | +9.56347 | +1.84967 | −4.67567 |
| Harris-Benedict, men | +13.75167 | +5.00337 | −6.7557 |
| Fat-free mass, 370 + 21.6 | +21.6 per kg of FFM4 | none | none |
Two things stand out. First, Harris-Benedict gives men a weight slope 44% above the women’s one, 13.7516 against 9.5634 (our arithmetic)7. Second, the fat-free-mass line has no age term at all. Cunningham found that sex and age added little once lean body mass was in the model5, and the Harris-Benedict reanalysis reached a related result: resting expenditure is directly related to the size of the body cell mass and independent of age and sex3.
How accurate are the formulas for one person?
They work on average, and less well for any one person. In a Tehran sample of 284 adults aged 18 to 60, Mifflin-St Jeor was among the equations with the best predictive value at group level, with mean percentage error between −2.2 and 2.4%8. At the individual level, the equations with the greatest accuracy still reached only 50 to 53% accuracy against measured values8. A study of 427 healthy Saudi adults tested nine equations and found none with an acceptable difference as low as 5% and about 55% accurate prediction at the individual level7.
Noteworthy errors and limitations exist when the equation is applied to individuals, and possibly when it is generalized to certain age and ethnic groups2. The Tehran authors conclude that race matters when predicting REE8.
Choosing a formula: populations and limits
Among general-purpose equations for healthy adults, Mifflin-St Jeor has the strongest evidence: it was the most reliable in the 2005 systematic review2. The fat-free-mass equations are the better choice when fat-free mass has actually been measured, because that is the variable the body’s resting rate tracks most closely4. They are no better when you must guess the input.
The caveats are about populations, not arithmetic:
- Older adults and ethnic minorities in the United States were underrepresented in both the development and the validation of equations2. For such groups a high level of suspicion about accuracy is warranted2.
- Very muscular and very overweight people can get identical results from a weight-height-age equation, since these equations do not account for body composition11.
- Malnourished patients are outside the range where the Harris-Benedict equations hold3.
- The FAO table comes mostly from Western European and North American studies6.
Where accuracy matters, measurement is the remedy: valid measurement by indirect calorimetry would eliminate estimation error2.
Mistakes with the formulas
- Mixing coefficient sets. The Harris-Benedict and Mifflin-St Jeor equations have different intercepts. Using the intercept from one and the slopes from the other gives a number that matches neither paper7.
- Wrong units. The equations take kilograms and centimeters. The FAO table lists megajoules and kilocalories in separate columns; for example, 5.40 MJ a day is 1,290 kcal a day6.
- Treating the result as exact. An answer like 1,370.25 has six digits and an error in the hundreds, as the five-way comparison shows1.
- Reading RMR as a needs number. It is one piece of daily expenditure, not an intake6.
- Skipping the population. A line fitted to one group may mispredict another8.
What next
With a resting rate in hand, the next step is the activity multiplier, covered on the TDEE page. The maximum heart rate formulas are another set of fitted lines with the same pattern: a simple regression, a named population and a standard error. The slopes in the table above are the same idea as the derivative rules on the derivative rules cheat sheet.
Common questions
What is the formula for resting metabolic rate?
There is no single one. Most are fitted lines in weight, height and age, such as 10 × kg + 6.25 × cm − 5 × age with +5 for men or −161 for women1. Some use fat-free mass instead: 370 + 21.6 × FFM4.
RelatedHow to Calculate TDEE (Total Daily Energy Expenditure)Maximum Heart Rate Formula: 220 − Age and Better OptionsSleep Cycle Calculator Math: How the 90 Minute Rule Works
Sources
- A new predictive equation for resting energy expenditure in healthy individuals · American Journal of Clinical Nutrition (Mifflin et al., 1990), via PubMed · pubmed.ncbi.nlm.nih.gov · checked October 21, 2026
- Comparison of predictive equations for resting metabolic rate in healthy nonobese and obese adults: a systematic review · Journal of the American Dietetic Association (Frankenfield et al., 2005), via PubMed · pubmed.ncbi.nlm.nih.gov · checked October 21, 2026
- The Harris Benedict equation reevaluated: resting energy requirements and the body cell mass · American Journal of Clinical Nutrition (Roza and Shizgal, 1984), via PubMed · pubmed.ncbi.nlm.nih.gov · checked October 21, 2026
- Body composition as a determinant of energy expenditure: a synthetic review and a proposed general prediction equation · American Journal of Clinical Nutrition (Cunningham, 1991), via PubMed · pubmed.ncbi.nlm.nih.gov · checked October 21, 2026
- A reanalysis of the factors influencing basal metabolic rate in normal adults · American Journal of Clinical Nutrition (Cunningham, 1980), via PubMed · pubmed.ncbi.nlm.nih.gov · checked October 21, 2026
- Human energy requirements, 5. Energy requirements of adults · FAO/WHO/UNU expert consultation, Food and Agriculture Organization · fao.org · checked October 21, 2026
- New Predictive Equations for Resting Energy Expenditure in Normal to Overweight and Obese Population · PubMed Central, National Library of Medicine · pmc.ncbi.nlm.nih.gov · checked October 21, 2026
- Development of a new equation and validation of earlier resting energy expenditure predicting equations in adults living in Tehran · PubMed Central, National Library of Medicine · pmc.ncbi.nlm.nih.gov · checked October 21, 2026
- Basal metabolic rate · Wikipedia · en.wikipedia.org · checked October 21, 2026
- Basal Metabolic Rate (BMR) & Eating Plan · Colorado State University Extension · goldenplains.extension.colostate.edu · checked October 21, 2026
- Harris-Benedict equation · Wikipedia · en.wikipedia.org · checked October 21, 2026
Published . Every source shows the day it was read. Diagrams: original, by the editors. How we check facts · Report an error.