How it works · Math of health
How to Calculate TDEE (Total Daily Energy Expenditure)
TDEE is resting energy times an activity factor. The Mifflin-St Jeor step, five multipliers, a worked example, a calculator and how big the error is.
Checked against 11 sources (11 textbook, course or government) · By Ambient Math editors
The short answer. Total daily energy expenditure is basal metabolic rate multiplied by a physical activity level3. Estimate the rate with Mifflin-St Jeor, 10 × weight (kg) + 6.25 × height (cm) − 5 × age, plus 5 for men or minus 161 for women1, then multiply by a factor from 1.2 to 1.94.
- Step 1
- Resting rate: 10 × kg + 6.25 × cm − 5 × age, then +5 (men) or −161 (women)1
- Typical error
- Equations reach within 10% of measured rate for most, not all, adults2
- Needs
- Weight in kg, height in cm, age in years
On this page
- BMR vs TDEE: what is the difference?
- Step 1: estimate BMR with an equation
- Step 2: multiply by an activity factor
- Worked example: a 30-year-old woman, 70 kg, 165 cm
- Try your own numbers
- How sensitive is the formula to each input?
- How accurate is a TDEE estimate?
- Why your TDEE changes over time
- Mistakes in the arithmetic
- Run it yourself
A TDEE calculator is two lines of arithmetic. The first line estimates what the body spends at rest. The second scales that figure up for the day’s movement3. Once you can do both lines by hand you can check any calculator, see where its error comes from and judge how far to trust the output. The numbers below come from the Mifflin-St Jeor paper, an FAO/WHO/UNU expert report and a systematic review of the equations. The math is the subject here. Nothing below sets an intake for anyone, which is a job for a registered dietitian or physician who knows your case. The health section has the neighboring formulas, and the same linear-model idea shows up in the loan payment formula.
BMR vs TDEE: what is the difference?
Total daily energy expenditure, TDEE, is everything the body spends in 24 hours. Basal metabolic rate, BMR, is its largest single piece: the amount of energy used to simply stay alive in the absence of any physical activity5. That covers breathing, circulation, nutrient processing and cell production5. In adults it makes up about 45 to 70 percent of total energy expenditure, and is determined principally by sex, body size, body composition and age3. Clinical writing uses BMR and resting energy expenditure, REE, almost interchangeably, and calls the rate the main determinant of TDEE4.
The rest of TDEE has three parts: exercise activity thermogenesis (planned exercise), non-exercise activity thermogenesis (walking, fidgeting, chores) and the thermic effect of food, the energy spent digesting4. A TDEE calculator does not estimate those three parts one by one. It lumps them into a single multiplier on BMR. That multiplier is what the FAO/WHO/UNU report calls the physical activity level, PAL, defined as PAL = TEE/BMR, where TEE is total energy expenditure3. Multiplying PAL by BMR gives the energy requirement of an adult3.
So the whole method is one product: TDEE = BMR × PAL.
Step 1: estimate BMR with an equation
BMR can be measured only under laboratory conditions3, so everyday use relies on predictive equations built from body weight, height, age and sex. Four equations dominate clinical practice: Harris-Benedict, Mifflin-St Jeor, Owen and the WHO/FAO/UNU equations2. This page uses Mifflin-St Jeor because it came out best in a systematic review: it predicted resting rate within 10% of the measured value in more people than any other equation, with the narrowest error range2.
The equation was derived from 498 healthy adults aged 19 to 78, with resting energy measured by indirect calorimetry1. In its simplified form, with weight in kilograms, height in centimeters and age in years:
| Sex | Simplified Mifflin-St Jeor equation (kcal/day) |
|---|---|
| Men | BMR = 10 × weight + 6.25 × height − 5 × age + 51 |
| Women | BMR = 10 × weight + 6.25 × height − 5 × age − 1611 |
The published forms are REE (males) = 10 x weight (kg) + 6.25 x height (cm) - 5 x age (y) + 5, and the same expression with −161 for females1. The unrounded version is REE = 9.99 x weight + 6.25 x height - 4.92 x age + 166 x sex - 161, with sex coded 1 for males and 0 for females1. Simplifying it did not change its predictive value1.
Older equations still turn up in many calculators. Harris-Benedict, from 1919, is in the table below. A later analysis that included the 1919 subjects (239 normal adults) put its precision at 14% for a normal subject10. The Mifflin authors found it overestimated measured resting energy by 5% in their sample1. A third equation needs fat-free mass (FFM), the body weight that is not fat, which few adults know. Its published form is REE = 370 + 21.6 × FFM11.
| Equation | Inputs | Form | Where it comes from |
|---|---|---|---|
| Mifflin-St Jeor (1990) | weight, height, age, sex | 10 × kg + 6.25 × cm − 5 × age, then +5 or −161 | 498 healthy adults1 |
| Harris-Benedict (1919) | weight, height, age, sex | men 66.473 + 13.7516 × kg + 5.0033 × cm − 6.755 × age; women 655.0955 + 9.5634 × kg + 1.8496 × cm − 4.6756 × age | 239 normal adults910 |
| Fat-free-mass equation | fat-free mass | 370 + 21.6 × FFM | synthetic review of body-composition studies11 |
The fat-free-mass form is a good example of why the inputs matter: in the Mifflin data, fat-free mass was the best single predictor of resting rate, with a fat-free-mass line of 19.7 x FFM + 4131. Weight and height stand in for body composition, which is why every weight-based equation misses people who are unusually lean or unusually muscular.
Step 2: multiply by an activity factor
Common calculators use five multipliers. The exercise-day definitions below come from an extension service handout5:
| Activity level | How it is defined | Multiplier |
|---|---|---|
| Sedentary | little or no exercise | 1.25 |
| Lightly active | light exercise or sports 1-3 days a week | 1.3755 |
| Moderately active | moderate exercise or sports 3-5 days a week | 1.555 |
| Very active | hard exercise or sports 6-7 days a week | 1.7255 |
| Extra active | very hard exercise, a physical job or two workouts a day | 1.95 |
A clinical reference compresses the same span to “from 1.2 for sedentary to 1.9 for very active”4. The FAO/WHO/UNU report builds its factor differently, from measurements of whole populations, and groups lifestyles into three bands: 1.40-1.69 sedentary or light, 1.70-1.99 active or moderately active, and 2.00-2.40 vigorous3. Values above 2.40 are difficult to maintain over a long period3. A meta-analysis of 411 men and women aged 18 to 64, mostly from affluent countries, found a modal PAL of 1.603. For the most part, those subjects were from affluent societies in developed countries3. Treat the factor as a band, not a single number, and be honest about which row you sit in. One FAO example makes the scale concrete: a daily hour of moderate to vigorous exercise can lift an average PAL from 1.55 to 1.753.
Worked example: a 30-year-old woman, 70 kg, 165 cm
The inputs follow a clinical example: a moderately active 30-year-old woman who weighs 70 kg and is 165 cm tall4. That example puts her BMR at approximately 1400 calories daily and applies 1.6 for moderate activity, for 2240 calories4. Below is the same calculation with the equation from step 1 and the 1.55 factor for moderate activity15.
Worked example (our arithmetic)
| Step | Calculation | Result |
|---|---|---|
| BMR, Mifflin-St Jeor (women) | 10 × 70 + 6.25 × 165 − 5 × 30 − 161 = 700 + 1,031.25 − 150 − 1611 | 1,420.25 kcal |
| TDEE, moderately active | 1,420.25 × 1.555 | 2,201.39 kcal, about 2,200 |
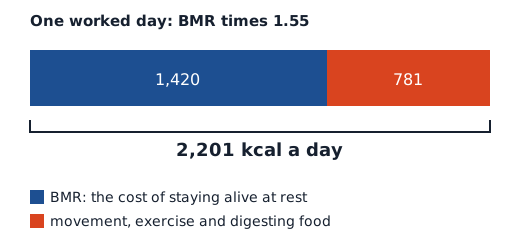
The two results differ by about 40 kcal (our arithmetic) because the textbook rounds the rate to 1,400 and uses 1.64. That is well inside the error discussed below. The diagram shows the split: about 1,420 kcal is resting cost, and the other 781 kcal is movement, exercise and digestion (our arithmetic).
Run the same woman through the other factors and you can see how much the multiplier alone moves the answer:
| Activity factor | Calculation (our arithmetic) | TDEE |
|---|---|---|
| 1.2 | 1,420.25 × 1.25 | 1,704 kcal |
| 1.375 | 1,420.25 × 1.3755 | 1,953 kcal |
| 1.55 | 1,420.25 × 1.555 | 2,201 kcal |
| 1.725 | 1,420.25 × 1.7255 | 2,450 kcal |
| 1.9 | 1,420.25 × 1.95 | 2,698 kcal |
The gap between the lowest and highest row is about 1,000 kcal a day for the same body (our arithmetic)5. The activity factor, not the BMR step, is the biggest lever on the result.
In our arithmetic, swapping in Harris-Benedict for her inputs makes the BMR 1,489 kcal, about 69 kcal above Mifflin-St Jeor9. Different equations can disagree by that much for the same person, and the disagreement is not a mistake in either one.
Try your own numbers
TDEE calculator
Mifflin-St Jeor plus an activity factor, in kilograms and centimeters. All arithmetic happens locally on this page, with no network request. The range is the result minus and plus 10 percent, the benchmark in the systematic review2.
- BMR
- –
- TDEE
- –
- Rough range
- –
The form opens with the worked example, so the first result is 1,420 and 2,201 kcal15. Change one input at a time to see which one matters.
How sensitive is the formula to each input?
A linear formula has a constant slope in every input, and that makes the sensitivity easy to read. In the Mifflin-St Jeor equation, one extra kilogram adds 10 to the BMR, one extra centimeter adds 6.25, and one extra year of age subtracts 51. Multiplying by the activity factor scales each of those slopes. At a factor of 1.55, one kilogram is worth 10 × 1.55 = 15.5 kcal of TDEE (our arithmetic). The sex term moves the result by 166 kcal of BMR between the two forms, because +5 minus −161 is 166 (our arithmetic)1.
This is why a wrong activity row matters more than a few kilograms of weight. Moving from the 1.55 row to the 1.725 row adds about 249 kcal to this woman’s result (our arithmetic)5, which is as much as 16 kg of body weight would add at the 1.55 factor (our arithmetic)1. The sensitivity is the slope, which is the derivative of a straight line: constant, and easy to compute.
How accurate is a TDEE estimate?
The estimate is rougher than a four-digit output suggests. Even the best equation has “noteworthy errors and limitations” when applied to individuals2. Predictions from Mifflin-St Jeor land within 10% of measured rate for more people than any rival, which also means a share of adults fall outside that band2. Older adults and US-residing ethnic minorities were underrepresented in the data used to build and test the equations2, and for such groups a high level of suspicion about the accuracy of the equations is warranted2. The review’s remedy is measurement: indirect calorimetry measures what equations estimate2.
Apply a 10% band, the benchmark the review used2, to the worked example. The BMR runs from about 1,278 to 1,562 kcal, and the TDEE from about 1,981 to 2,422 kcal (our arithmetic). That band covers only the BMR step. It leaves out the uncertainty in the multiplier, which is the larger source, as the table above showed.
Because the error runs in both directions, a figure rounded to the nearest ten calories carries no extra information. The NIH Body Weight Planner, a government tool, warns that its own values are accurate for the typical user, and will be too high if metabolism is abnormally low or the user is very sedentary8.
Why your TDEE changes over time
The formula contains your weight and age, so it moves when they do. Three results from the research literature set the scale:
- Adulthood is flat. After adjusting for fat-free mass, doubly labeled water measurements show total expenditure staying stable between the ages of 20 and 60, then declining in older adults6. The −5 per year age term in the BMR equation is a population average, not a law of decline in your 30s.
- Size matters. Total expenditure rises with fat-free mass in a power-law manner6. The Cunningham review found fat-free mass predicts TDEE about as well as it predicts resting rate11.
- The body adapts. When intake falls and weight drops, resting energy expenditure can fall by more than the loss of fat-free mass alone predicts, an effect called adaptive thermogenesis4. A lower BMR leads to a lower TDEE4. A smaller body also burns fewer calories in non-exercise activity4.
Weight itself responds slowly to an energy imbalance. A dynamic model published in The Lancet found a half time of about 1 year for the bodyweight response to a change in energy intake7. That is why a TDEE figure is a snapshot to recompute whenever weight, activity or age changes meaningfully, not a number to set once.
Mistakes in the arithmetic
- Mixing units. The equation wants kilograms and centimeters1. A weight of 154 pounds typed in as 154 kilograms gives a BMR about 840 kcal too high (our arithmetic). Convert pounds by dividing by 2.2 and inches by multiplying by 2.54.
- Pairing an equation with the wrong multiplier. The 1.2 to 1.9 scale is a convention for BMR4. The FAO bands were derived for population averages3. Do not mix a band from one with a number from the other without saying so.
- Counting exercise twice. The activity factor already includes the day’s exercise5. Adding a workout’s calories on top of a TDEE built from the 1.55 row counts it twice.
- Reading TDEE as a target. TDEE is an estimate of energy spent. It is not a recommendation about what to eat, and nothing on this page is advice about diet or health.
- False precision. A result like 2,201.39 kcal5 has six significant digits and a real uncertainty of hundreds. Quote the range, or round hard.
Run it yourself
Pick a body, write down weight, height and age, and compute BMR from the equation. Then choose the multiplier row you can defend and multiply. Repeat with Harris-Benedict and one other factor, and look at how far apart the answers sit. That spread is the honest size of the estimate. The heart rate formulas share the same structure: a simple linear equation from a regression, with a standard error you can see only by reading the paper. The resting metabolic rate formulas page compares each BMR equation in turn.
Read next
Resting metabolic rate formulas compared
The resting metabolic rate formulas side by side: coefficients, who each was built on, worked example and how far they disagree and miss.
Math of healthMaximum Heart Rate Formula: 220 − Age and Better Options
The maximum heart rate formulas compared: 220 minus age, Tanaka, Gellish, Nes and Gulati, with population, error, an age table and worked example.
Math of healthSleep Cycle Calculator Math: How the 90 Minute Rule Works
Sleep cycles average 90 minutes, so bedtime math is subtraction. See the formula, bedtime tables, a cosine model, and why cycles vary from 60 to 110 minutes.
Sources
- A new predictive equation for resting energy expenditure in healthy individuals · American Journal of Clinical Nutrition (Mifflin et al., 1990), via PubMed · pubmed.ncbi.nlm.nih.gov · checked October 21, 2026
- Comparison of predictive equations for resting metabolic rate in healthy nonobese and obese adults: a systematic review · Journal of the American Dietetic Association (Frankenfield et al., 2005), via PubMed · pubmed.ncbi.nlm.nih.gov · checked October 21, 2026
- Human energy requirements, 5. Energy requirements of adults · FAO/WHO/UNU expert consultation, Food and Agriculture Organization · fao.org · checked October 21, 2026
- Management of Weight Loss Plateau · StatPearls, NCBI Bookshelf, National Library of Medicine · ncbi.nlm.nih.gov · checked October 21, 2026
- Basal Metabolic Rate (BMR) & Eating Plan · Colorado State University Extension · goldenplains.extension.colostate.edu · checked October 21, 2026
- Daily energy expenditure through the human life course · Science (Pontzer et al., 2021), via PubMed · pubmed.ncbi.nlm.nih.gov · checked October 21, 2026
- Quantification of the effect of energy imbalance on bodyweight · The Lancet (Hall et al., 2011), via PubMed · pubmed.ncbi.nlm.nih.gov · checked October 21, 2026
- Body Weight Planner · National Institute of Diabetes and Digestive and Kidney Diseases · niddk.nih.gov · checked October 21, 2026
- New Predictive Equations for Resting Energy Expenditure in Normal to Overweight and Obese Population · PubMed Central, National Library of Medicine · pmc.ncbi.nlm.nih.gov · checked October 21, 2026
- The Harris Benedict equation reevaluated: resting energy requirements and the body cell mass · American Journal of Clinical Nutrition (Roza and Shizgal, 1984), via PubMed · pubmed.ncbi.nlm.nih.gov · checked October 21, 2026
- Body composition as a determinant of energy expenditure: a synthetic review and a proposed general prediction equation · American Journal of Clinical Nutrition (Cunningham, 1991), via PubMed · pubmed.ncbi.nlm.nih.gov · checked October 21, 2026
Published . Every source shows the day it was read. Diagrams: original, by the editors. How we check facts · Report an error.